

— Blogs —
—Products—
 Consumer hotline +8618073152920
 WhatsApp:+8615367865107
Address:Room 102, District D, Houhu Industrial Park, Yuelu District, Changsha City, Hunan Province, China
Product knowledge
Time:2025-09-20 15:00:05 Popularity:564
Surface water quality monitoring is a cornerstone of water resource management and environmental protection, aimed at assessing the quality of surface waters such as rivers, lakes, and reservoirs. It provides insights into the distribution and variation of pollutants, offering a scientific basis for water environment management, drinking water safety, and ecological conservation. With the growing severity of water pollution and the promotion of management models like smart water systems and the River Chief System, the importance of surface water quality monitoring has become increasingly evident. This article comprehensively covers the basic data collection, monitoring site selection, sampling timing and frequency, monitoring technology choices, and result presentation and quality assurance for surface water quality monitoring, providing a systematic reference for practitioners.
The first step in surface water quality monitoring is collecting background data related to the water body to gain a comprehensive understanding of its natural and anthropogenic characteristics. This data forms the foundation for designing monitoring programs and analyzing results, covering the following aspects:
- Hydrological Data: Includes water level, flow rate, velocity, and river cross-section morphology, reflecting the dynamic changes of the water body. Historical hydrological data and trends should be recorded.
- Climatic Data: Rainfall, evaporation, and temperature affect dissolved oxygen levels, pollutant dispersion, and water quality changes.
- Geological and Topographic Data: Riverbed structure, soil type, geological conditions (e.g., karst landscapes), and river width and depth influence water quality distribution and pollutant migration.
- Historical Water Volume: Analysis of flow variations during wet, dry, and normal seasons to inform sampling timing.
- Urban and Industrial Layout: Distribution of cities, industrial zones, types of pollution sources (e.g., point or non-point sources), and their discharge volumes.
- Drainage Conditions: Locations and treatment capacities of urban drainage systems and wastewater treatment plant outlets.
- Pollution Source Analysis: Identification of major pollution sources (e.g., industrial wastewater, agricultural runoff, domestic sewage) and their discharge characteristics.
- Drinking Water Sources: Locations, protected area boundaries, and water quality standards for drinking water sources.
- Land Functions: Current land use in the watershed (e.g., agriculture, industry, ecological protection) and recent planning.
- Functional Zoning: Identification of areas for water-based recreation, tourism, or hydropower facilities.
- Historical Water Quality Data: Past monitoring results and trends in pollutant concentrations.
- Hydrological Observation Data: Long-term data from hydrological stations to analyze correlations between water quality and hydrological conditions.
- Water Environment Research: Academic studies, environmental impact assessments, and other reports to supplement background information.
Scientifically designed monitoring sections and sampling points are critical for ensuring the representativeness and reliability of water quality data. The following are the principles and requirements for their setup:
- Representativeness: Monitoring sections should comprehensively reflect the spatial distribution of water quality and pollutant variations, covering major pollution zones and functional areas.
- Comprehensiveness: Based on monitoring objectives (e.g., drinking water protection, pollution control) and parameters (e.g., pH, COD, dissolved oxygen), determine the number and location of sections while considering resources like manpower and equipment.
- Consistency: Align monitoring sections with hydrological monitoring sections to facilitate correlation analysis between water quality and hydrological data.
- Operability: Sections should be accessible, with clear shoreline markers, to ease sampling and maintenance.
Sampling point selection should consider water body characteristics, pollution source distribution, and functional area requirements:
- Upstream and Downstream of Pollution Sources: Set points upstream and downstream of major cities, industrial zones, or wastewater discharge outlets to monitor pollutant input and dispersion.
- Tributary Confluences: Place points at the confluence of significant tributaries with the main stream and in fully mixed sections downstream.
- Special Areas:
- River Estuaries and Tidal Zones: Monitor water quality in estuaries or tidally influenced sections to analyze interactions between salinity and pollutants.
- Areas with Severe Soil Erosion: Focus on the impact of sediment on turbidity and pollutant migration.
- Lake and Reservoir Inlets/Outlets: Monitor water quality changes at primary inlets and outlets.
- International River Borders: Monitor water quality in cross-border water bodies.
- Functional Areas: Set points in drinking water source areas, water resource concentration zones, tourism areas, recreational water zones, and hydropower facility locations to meet specific water quality management needs.
- Section Selection Requirements:
- Avoid stagnant, backflow, or rapid-flow areas; select straight river sections with stable riverbeds and smooth flow.
- Ensure sampling points represent mainstream water quality, avoiding localized interference (e.g., near discharge outlets or dense aquatic vegetation).
Sampling timing and frequency should be determined based on water body type, monitoring objectives, and environmental change characteristics to balance data representativeness and monitoring costs.
3.1 Drinking Water Sources
- Frequency: At least 12 samples per year (monthly or more frequent).
- Timing: Adjust based on water quality fluctuations, prioritizing seasons with higher pollution risks (e.g., rainy season).
3.2 Rivers
- Main Streams of Large River Systems and Small/Medium Rivers:
- Frequency: At least 6 samples per year, covering wet, dry, and normal seasons, with at least 2 samples per season.
- Timing: Select representative times based on hydrological cycles, such as rainy seasons (wet) or winter (dry).
- Heavily Polluted or Functional Area Rivers (e.g., Urban or Tourism Sections):
- Frequency: At least 12 samples per year (monthly or more frequent based on pollution patterns).
- Timing: Align with pollution discharge patterns or peak tourism periods.
3.3 Sewers
- Frequency: At least 3 samples per year, focusing on peak pollution discharge periods.
- Timing: Select based on drainage patterns, such as rainy seasons or industrial production peaks.
3.4 Sediments
- Frequency: At least 1 sample per year, preferably during the dry season (when sediments are stable).
- Timing: Avoid rainy seasons with sediment disturbance to ensure results reflect sediment pollution characteristics.
3.5 Background Sections
- Frequency: At least 1 sample per year.
- Timing: Choose seasons with higher pollution risks (e.g., rainy season or agricultural fertilization periods).
3.6 Tidal Rivers
- Frequency: Cover wet, normal, and dry seasons, with sampling over 2 days per season.
- Timing: Sample during high and low tides each day, measuring water quality and hydrological parameters.
3.7 Lakes and Reservoirs
- Dedicated Monitoring Stations: At least 1 sample per month, with a minimum of 12 samples per year.
- Other Lakes/Reservoirs: At least 2 samples per year, one each in wet and dry seasons.
- Timing: Select representative times based on seasonal water body changes.
Water quality monitoring involves various parameters (e.g., pH, COD, dissolved oxygen, turbidity, heavy metals), requiring appropriate sampling and analysis techniques based on the target’s properties, concentration range, and precision requirements.
- Manual Sampling: Suitable for low-frequency, small-scale monitoring, using sampling bottles or dedicated samplers to ensure uncontaminated samples.
- Automatic Sampling: Uses automated samplers for timed, quantitative sampling, ideal for long-term online monitoring.
- Sampling Considerations:
- Use clean, uncontaminated containers (e.g., polyethylene or glass bottles).
- Select sampling depth (e.g., surface, mid-layer, or bottom water) based on monitoring parameters.
- Prevent physical, chemical, or biological changes during sample transport or storage (e.g., use preservatives or refrigerate).
- Chemical Analysis:
- COD: Potassium dichromate method, UV absorption method.
- Ammonia Nitrogen: Nessler’s reagent colorimetric method, ion-selective electrode method.
- Heavy Metals: Atomic absorption spectroscopy, inductively coupled plasma mass spectrometry (ICP-MS).
- pH Sensors: Electrochemical method for measuring water acidity/alkalinity.
- Dissolved Oxygen Sensors: Electrochemical or fluorescence methods to monitor oxygen levels.
- Turbidity Sensors: Optical method to measure suspended particle concentration.
- Multi-Parameter Sensors: Integrate pH, COD, dissolved oxygen, etc., for real-time online monitoring.
- Remote Sensing and Drone Technology: Use satellite or drone imagery combined with water quality models to monitor pollution distribution across large water bodies.
- Choose high-sensitivity, high-precision methods based on the parameter’s chemical properties and concentration range.
- Prioritize methods compliant with national standards (e.g., China’s Surface Water Environmental Quality Standard GB 3838-2002).
- Balance monitoring frequency and cost by selecting online sensors or laboratory analysis.
Water quality monitoring data should be processed and visualized scientifically to facilitate analysis and decision-making:
- Data Processing: Use statistical analysis (e.g., mean, standard deviation, trend analysis) or water quality models to calculate pollutant concentrations, trends, and loads.
- Presentation Forms:
- Monitoring Reports: Include water quality parameters, section data, pollution source analysis, and management recommendations.
- Charts and Maps: Use line graphs, bar charts, or GIS maps to display spatial and temporal water quality variations.
- Online Platforms: Real-time water quality data display via IoT platforms for public access and regulatory decision-making.
Quality assurance (QA) is critical to ensuring data accuracy and reliability throughout the monitoring process:
- Instrument Calibration: Regularly calibrate sensors and analytical instruments using standard solutions.
- Sample Control: Use blank, parallel, and standard samples to ensure contamination-free sampling and analysis.
- Data Validation: Confirm data consistency through duplicate measurements, cross-validation, or third-party audits.
- Personnel Training: Ensure sampling and analysis personnel are skilled and familiar with standard operating procedures (SOPs).
- Record Management: Maintain complete records of sampling time, location, methods, and results for traceability.
The implementation plan outlines specific arrangements for the monitoring program, ensuring scientific rigor, feasibility, and coordination:
- Timeline: Specify time nodes for sampling, analysis, data processing, and report submission.
- Resource Allocation: Allocate manpower, equipment, and materials efficiently to complete tasks.
- Emergency Plans: Develop rapid response and monitoring plans for sudden pollution events (e.g., leaks, overflows).
- Collaboration Mechanisms: Coordinate resources among environmental, water, and research institutions for efficient monitoring.
- Environmental Protection: Provides water quality data to identify pollution sources and guide management measures.
- Drinking Water Safety: Ensures water quality in source areas, protecting public health.
- Ecological Conservation: Monitors water body ecological health to support biodiversity protection.
- Policy Support: Provides data for the River Chief System, smart water systems, and grid-based management, enabling precise governance.
- Data Representativeness: Monitoring sections and sampling points must be scientifically designed to avoid localized biases affecting overall assessments.
- Monitoring Costs: High-precision instruments and frequent sampling increase financial burdens, requiring optimized resource allocation.
- Complex Water Bodies: Tidal rivers, lakes, and reservoirs are influenced by multiple factors, posing monitoring challenges.
- Data Integration: Standardizing and integrating multi-source data requires unified platforms to avoid data silos.
Advancements in technology are driving the following trends in surface water quality monitoring:
- Smart Systems and IoT: Multi-parameter sensors and IoT enable real-time, grid-based monitoring, improving data collection efficiency.
- Big Data and AI: Machine learning for water quality trend analysis and pollution risk prediction to optimize management strategies.
- Remote Sensing: Satellite and drone monitoring for large-scale water bodies, enhancing spatial resolution.
- Green Monitoring: Development of low-energy, reagent-free sensors (e.g., UV-based COD sensors) to reduce environmental impact.
Surface water quality monitoring is fundamental to water resource management and environmental protection, providing reliable data for water quality assessment and management through scientific data collection, section design, sampling frequency, and technology selection. Effective result presentation and stringent quality assurance ensure data accuracy and utility. With the advancement of smart water systems and the River Chief System, surface water quality monitoring is evolving toward intelligence, precision, and sustainability, offering robust support for sustainable water environment management.
Related recommendations
Sensors & Weather Stations Catalog
Agriculture Sensors and Weather Stations Catalog-NiuBoL.pdf
Weather Stations Catalog-NiuBoL.pdf
Related products
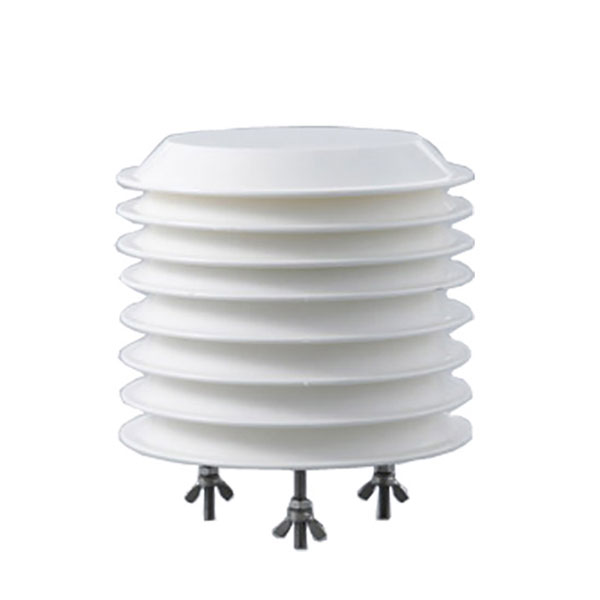 Combined air temperature and relative humidity sensor
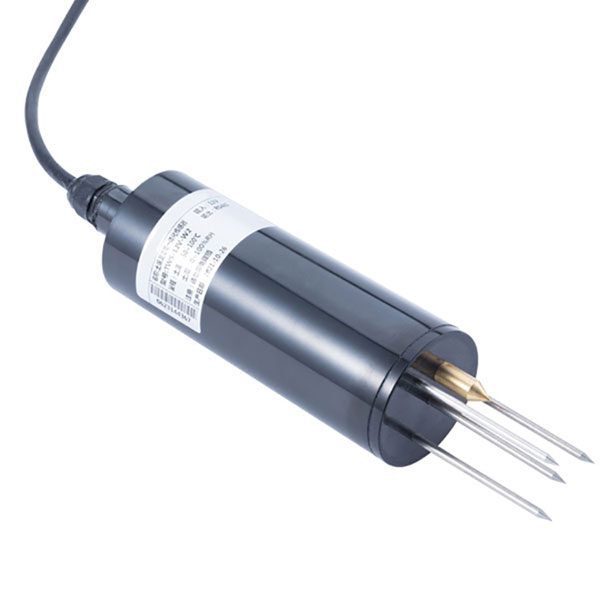 Soil Moisture Temperature sensor for irrigation
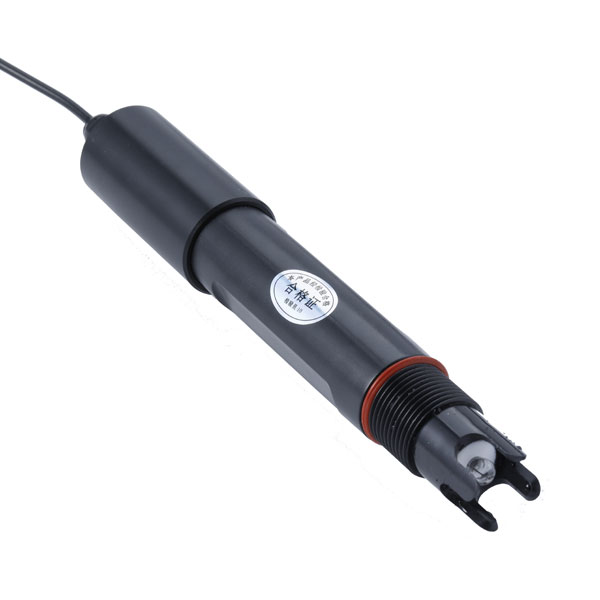 Soil pH sensor RS485 soil Testing instrument soil ph meter for agriculture
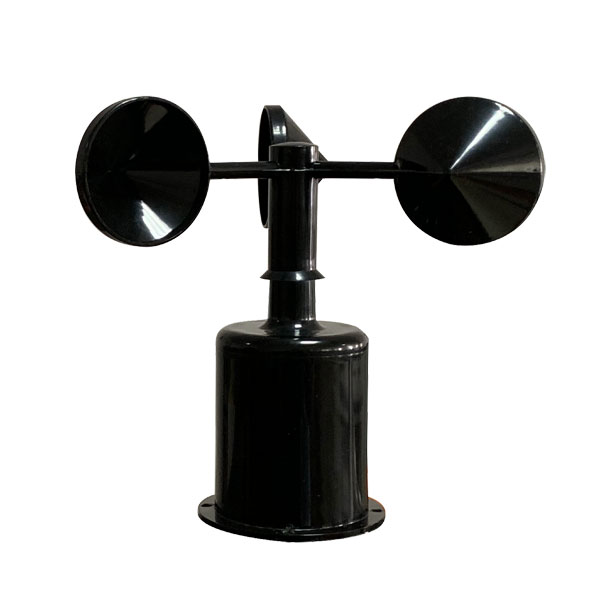 Wind Speed sensor Output Modbus/RS485/Analog/0-5V/4-20mA
 Tipping bucket rain gauge for weather monitoring auto rainfall sensor RS485/Outdoor/stainless steel
 Pyranometer Solar Radiation Sensor 4-20mA/RS485
Screenshot, WhatsApp to identify the QR code
WhatsApp number:+8615367865107
(Click on WhatsApp to copy and add friends)
