





— Blogs —
—Products—
 Consumer hotline +8618073152920
WhatsApp:+8615367865107
Address:Room 102, District D, Houhu Industrial Park, Yuelu District, Changsha City, Hunan Province, China
Product knowledge
Time:2024-12-09 20:44:32 Popularity:1878
A commercial weather station is a configured observation system used to support an organization's operations, reporting or research. The term alone does not establish accuracy, certification or suitability for a regulated application. For NiuBoL projects, its practical value depends on whether the installed sensors produce a traceable site record: defined quantities, suitable exposure, consistent timestamps, documented changes and access to the data needed by the customer.
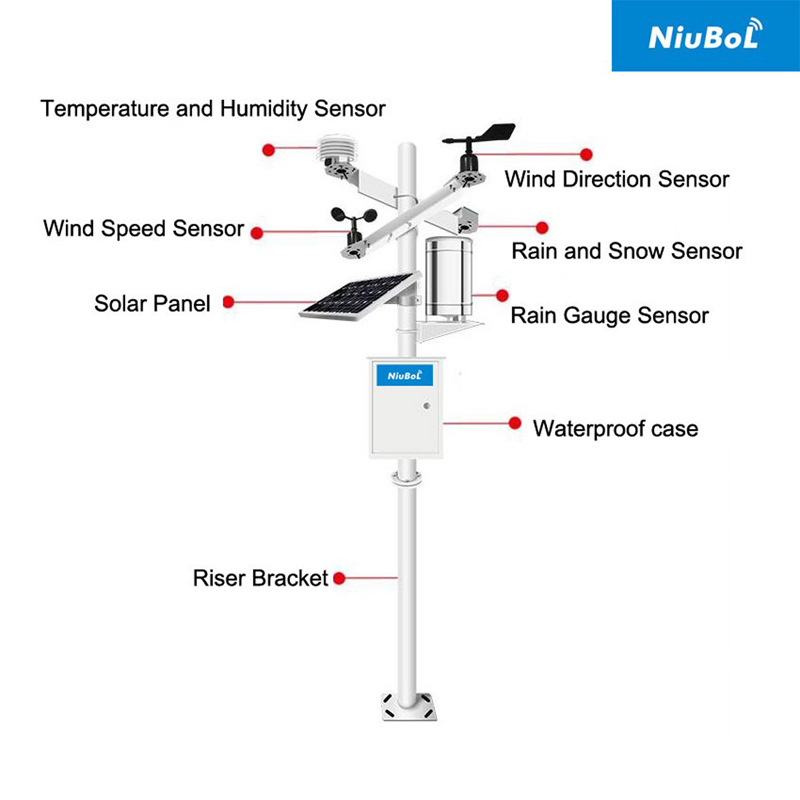
A station at a farm, a construction site and a solar plant may all measure wind and air temperature. Their records answer different questions. A farm may compare growing seasons; a contractor may review conditions during a work interruption; a solar operator may compare irradiance with generation. Equipment selected for one duty is not automatically sufficient for the others.
Start by naming the record that must exist after a month or a year of operation. Specify its channels, units, recording interval and intended use. This is more informative than asking for every available sensor. A large parameter count cannot compensate for an unrepresentative measurement position or a dataset that the customer cannot retrieve.
A commercial weather station can combine air temperature, relative humidity, pressure, wind, rainfall and radiation with optional soil or environmental instruments. Not all are standard components. Soil moisture is a different quantity from air humidity, and a water-quality probe belongs to a separate measurement duty even when its data reaches the same platform.
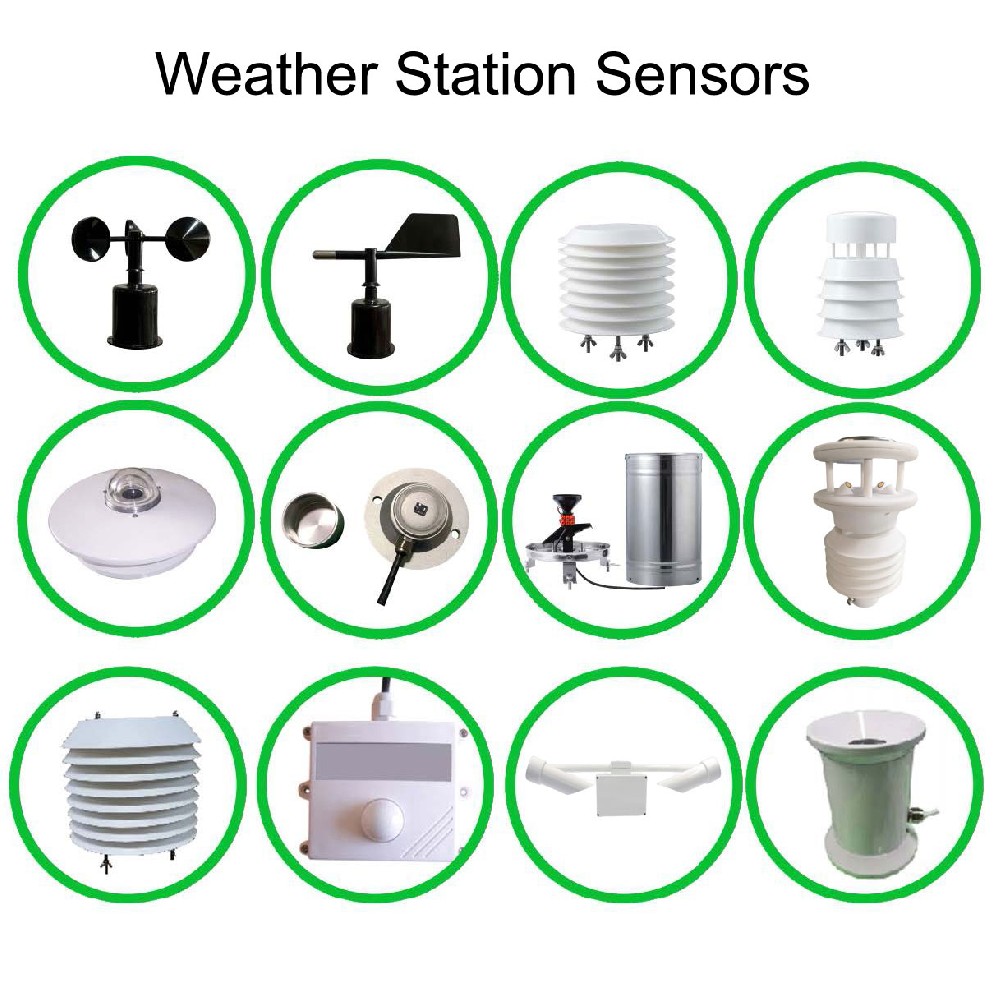
Record which physical instrument supplies each channel. A combined probe can supply several measurements, but calculated values should remain identifiable as calculations. Dew point, rainfall intensity from tip counts and time-integrated solar energy depend on processing as well as sensor data. Retain enough configuration information to reproduce the calculation when software is changed.
The following examples show why performance belongs to individual channels rather than to the station as a whole. Select the appropriate output and power version for each instrument; the figures do not specify a complete package.
| NiuBoL instrument | Example measurement specifications | Condition to retain with the record |
|---|---|---|
| NBL-W-LBTH temperature, humidity and pressure sensor | -40 to +80 C, +/-0.5 C; 0-100% RH, +/-5% RH; 10-1200 hPa, +/-1.5 hPa | Record exposure and whether pressure is reported at station level or converted to another reference. |
| NBL-W-RS rain gauge | 0.2 mm resolution; 0-4 mm/min; +/-4% in an indoor static test at 2 mm/min | Retain the tip increment and accumulation period. Standard operating temperature is 0-50 C. |
| NBL-W-HPRS pyranometer | 0-2000 W/m2; spectral range 0.3-3 micrometres; response time up to 35 seconds at 99% | Record the measurement plane. A horizontal reading is not an independent direct-beam measurement. |
Measurement, acquisition, transmission and display are separate stages. The logger reads the sensors and creates records; the network transports them; the receiving application stores and presents them. When a value is wrong, locating the first stage where it changed is more useful than replacing hardware indiscriminately.
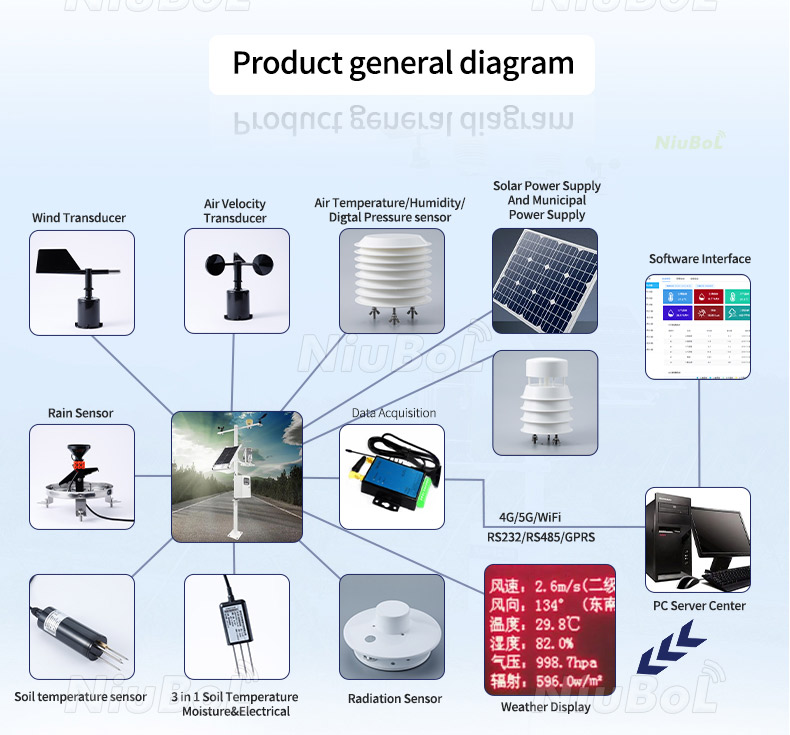
For example, compare the sensor response with the logger value, then compare the logger value with the server record. Preserve the unit, scale and station identifier at each step. A tenfold scaling error may still produce a smooth trend, while an incorrect station identifier may place valid readings under the wrong site.
RS485 Modbus RTU provides a route from compatible instruments to a logger, not a complete data policy. Configure device addresses, registers and scaling for the delivered versions. An analog transmitter needs a matching input range; a contact-output rain gauge needs a validated counter. These choices determine whether the intended quantities are recorded correctly.

A local screen is useful during service, and a remote dashboard helps operators spot changing conditions. Neither alone establishes that historical data is complete. Before selecting software, inspect an example export containing observation times, units, station identity and missing-value handling. Check that a user with the agreed permissions can retrieve the required period.
The TG462 / TG462S logger family offers local storage and network functions, but required retention, power-restart behavior and automatic retransmission must be agreed for the configured software. Choose the touchscreen version for a defined local operating need, rather than treating a screen as evidence of better measurement accuracy.
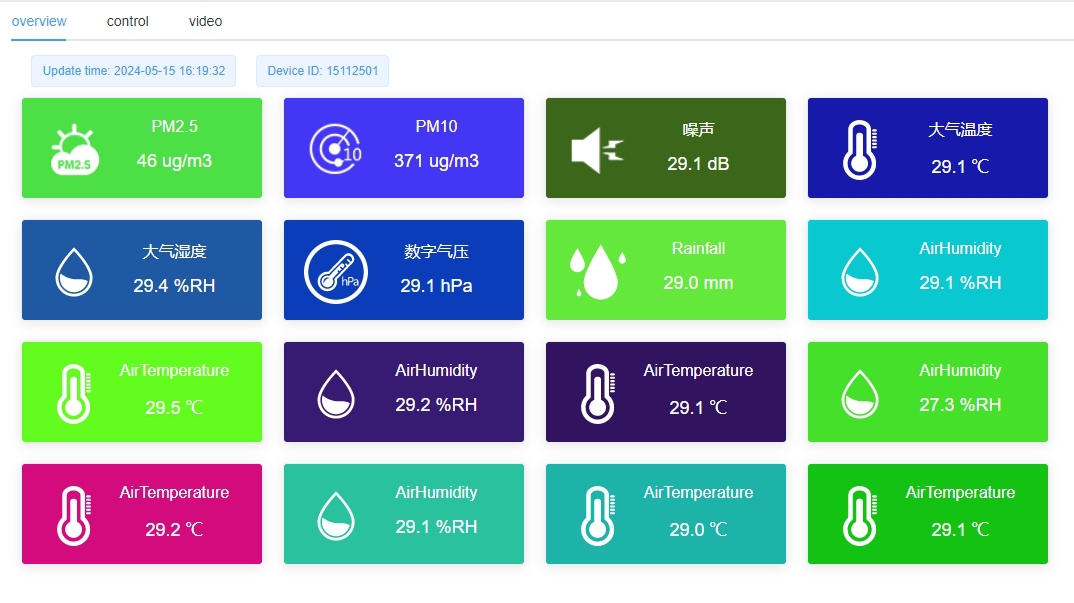
Distinguish a valid zero from an unavailable channel. Zero rainfall can be meaningful; a missing rain-gauge response is not zero rainfall. Likewise, do not leave an old value presented as current after communications stop. Showing the age of the last observation prevents a visually active dashboard from concealing a failed station.
A long-term farm record can change when nearby crops become taller, trees grow, a fence is added or a sensor is moved. These changes may alter wind exposure, shading or local temperature without any electronic fault. Keep a dated site description and photographs with sensor heights and surrounding features that matter to the observations.
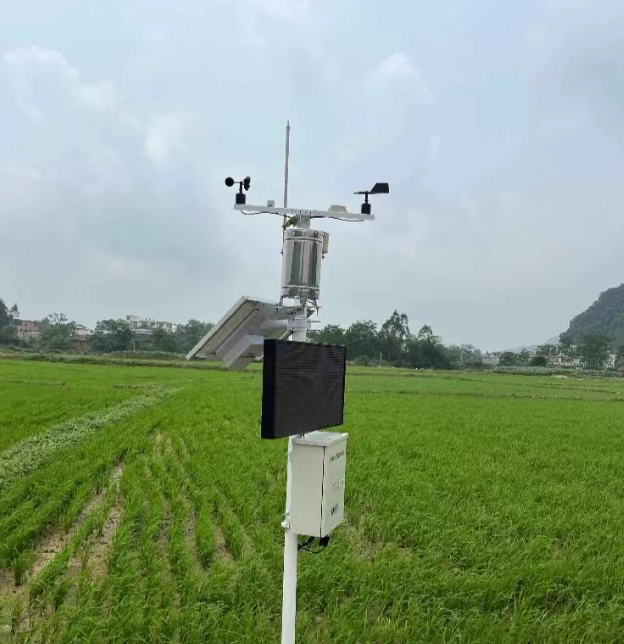
When a probe is replaced, record the old and new identifiers, the change date, configuration and any comparison made during the transition. A new sensor may restore reliable operation, but joining its values to the old series without a change note can hide a discontinuity. Where continuity is important, plan a comparison period instead of assuming identical model names imply identical installed readings.
A site with a solar panel still needs an energy budget for the logger, communication module, sensors and display. A station can transmit normally on sunny days yet fail during the cloudy period the project most needs to observe. Select battery autonomy using the actual load schedule and local charging conditions.
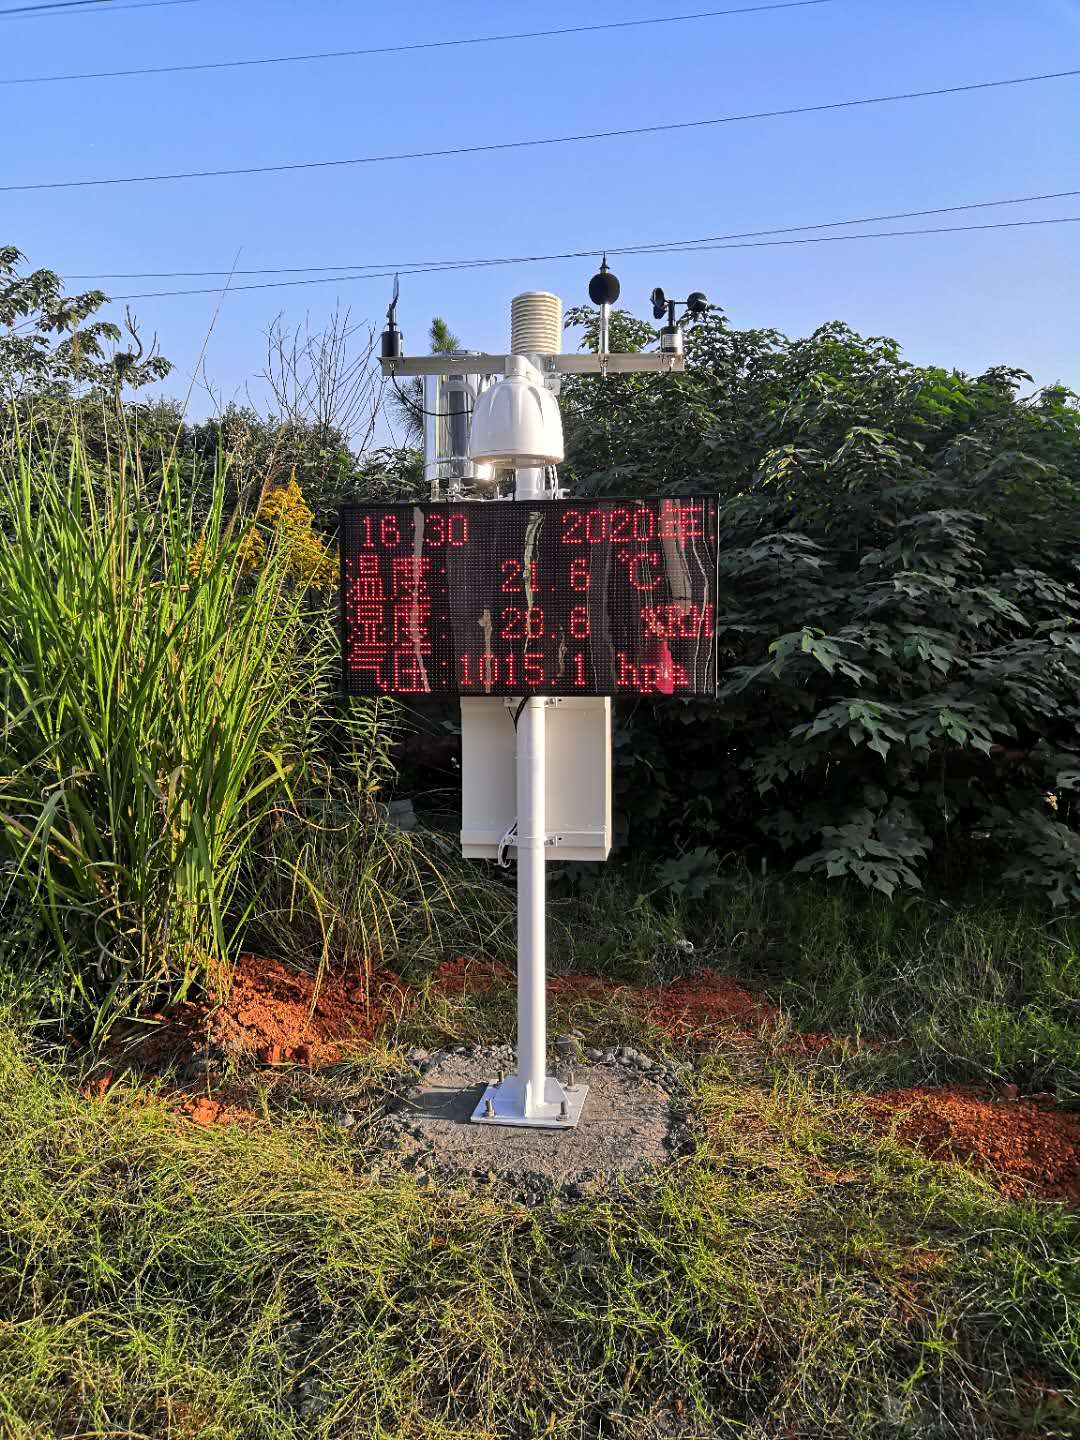
Track availability separately from weather. One useful completeness measure is valid records divided by expected records for a defined period. If a one-minute schedule expects 1,440 records in a day and only 1,368 are valid, completeness is 95%. This illustrative calculation describes coverage, not sensor accuracy, and must define how duplicates, invalid channels and planned maintenance are counted.
Service should target the instrument's failure modes. Inspect rain-gauge water paths and leveling, clean radiation optics as appropriate, check wind mechanisms and inspect the temperature shield. Choose intervals from site conditions and equipment instructions; a dusty industrial site and a clean research enclosure need not use the same schedule.
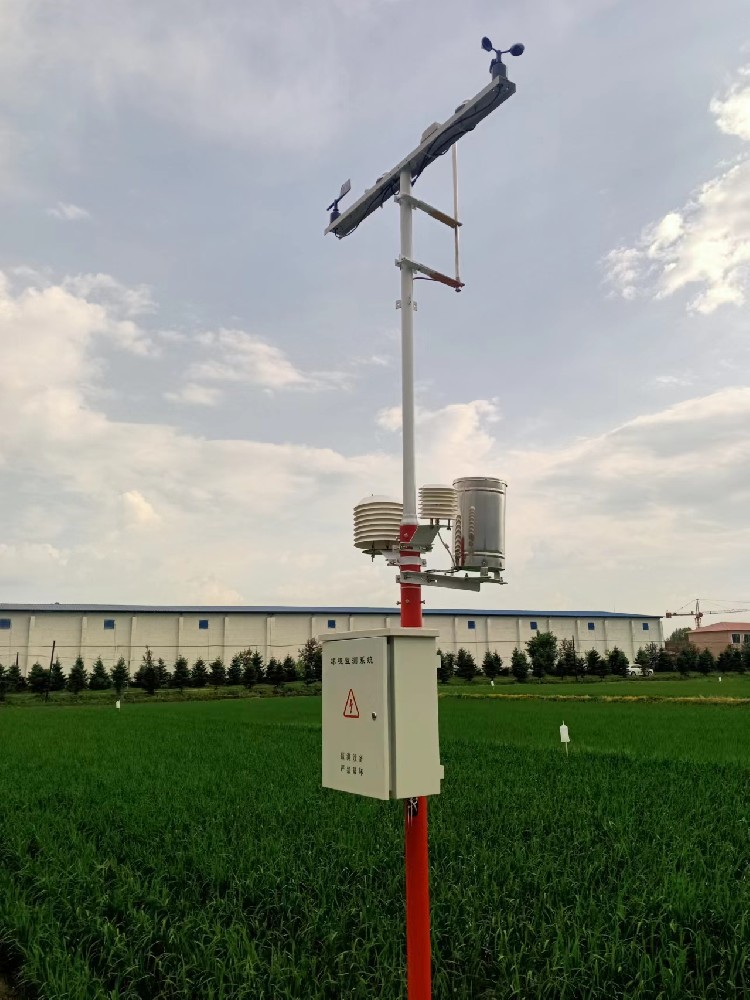
Record service times and affected channels. A funnel cleaning or deliberate water test can create readings that should not be interpreted as natural rain. A sensor check should identify the method, reference and result, rather than simply marking the whole station "calibrated". Keep service annotations with exported data where users need to exclude disturbed periods.
For a highway project, atmospheric observations may need a visibility instrument and separate pavement measurements. The NBL-W-VS visibility sensor estimates Meteorological Optical Range from forward-scattered light; it is not a camera view or a direct road-friction measurement. A weather assembly on a mast should therefore be evaluated channel by channel.

At solar sites, irradiance supports performance analysis only when the measurement plane and time interval match the analysis. At reservoirs, rainfall provides context for runoff, while water level requires its own instrument. At airports or ports, project-specific approvals and specialist observations may be needed; a general commercial station should not be represented as an approved operational system merely because it measures weather.
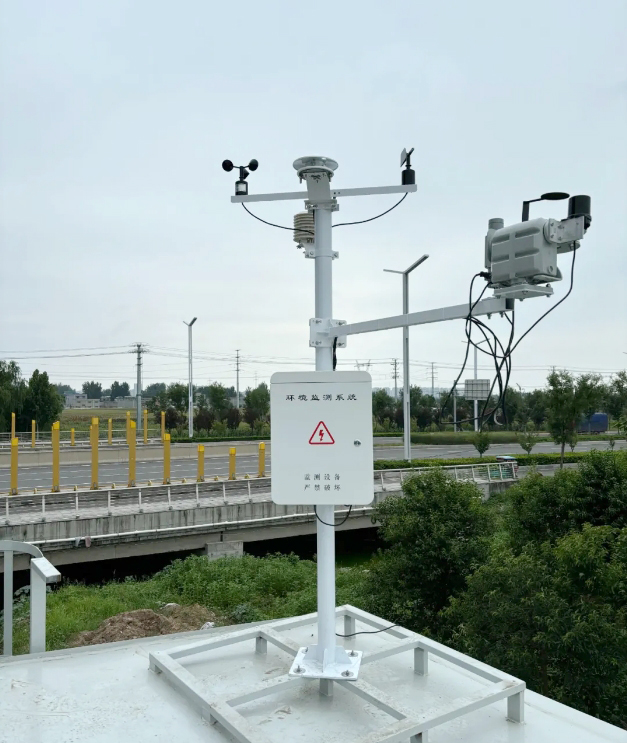
For a distributor or engineering contractor, these boundaries make quotations more precise. State the observation duties the proposed NiuBoL station covers, identify specialist equipment separately and agree which party maintains the historical record. That gives the customer a usable system scope without suggesting that every application illustrated is included in one package.
No. Evaluate the stated specification and conditions for each sensor, along with installation exposure and processing. Ask for any required calibration or conformity documents by name. The commercial label is not a substitute for those requirements.
It can, if the channel performance, exposure, recording scheme and documentation meet both uses. Operational relocations and maintenance may interrupt research comparability, so establish how those changes will be documented before combining the duties.
No. Agree account administration, export access, retention and continued retrieval if a service changes. A dashboard login does not by itself establish access to all historical records or to a customer-defined server interface.
Show completeness and the treatment of missing intervals alongside calculated statistics. Do not silently replace gaps with zeros. A daily rainfall total recovered from a cumulative counter may still lack the timing needed for short-storm analysis.
Send the intended observation record, application, site description, required sensor performance and data-access arrangements. Include any specialist approval, service or calibration requirements so NiuBoL can distinguish the base station from additional project scope.
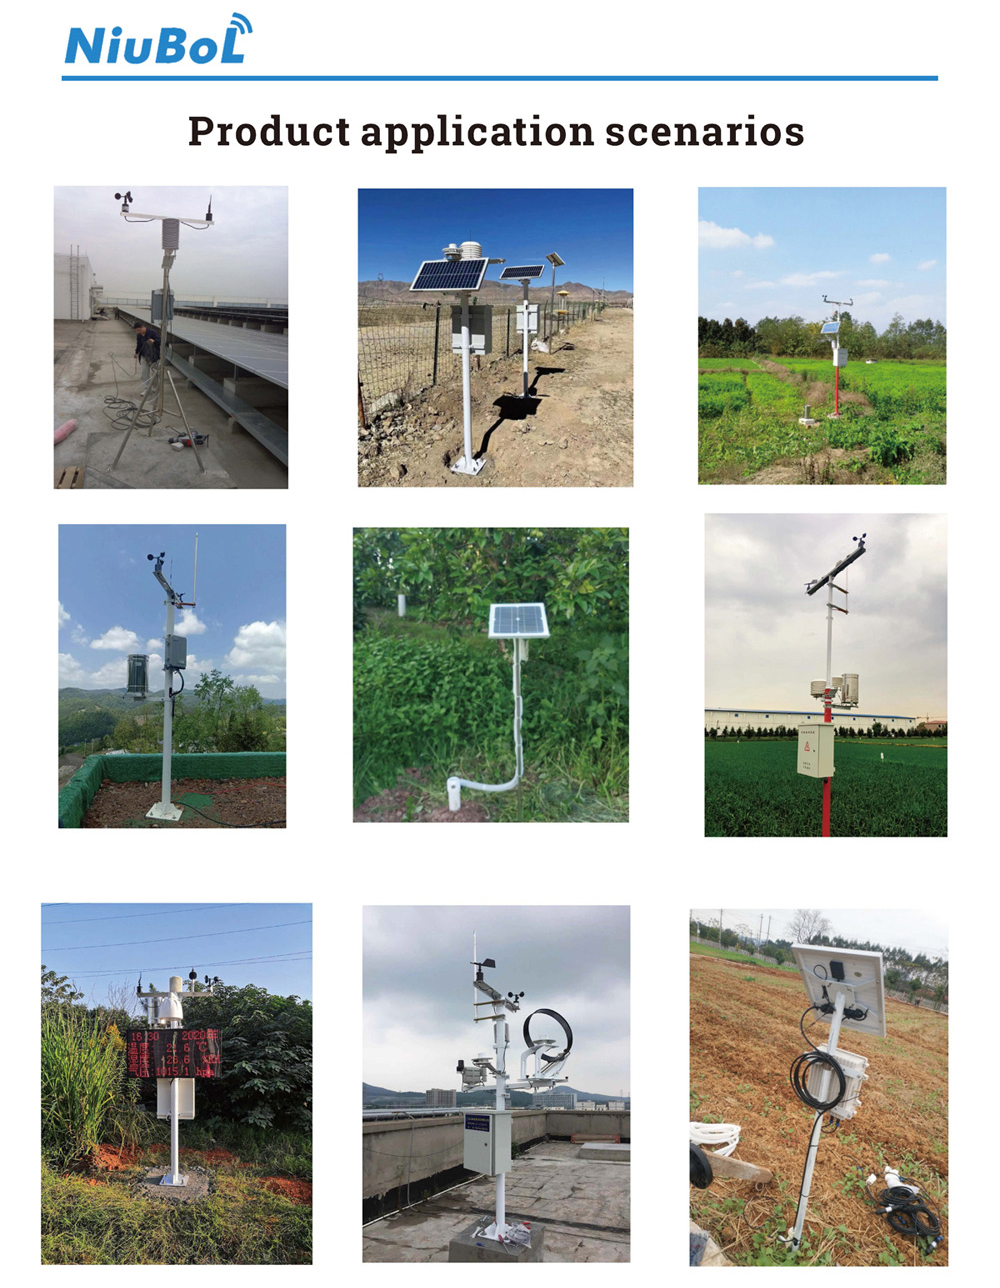
A commercial weather station is useful when its readings remain interpretable after the live display has changed. Defined measurements, documented exposure, recoverable records and dated service information allow customers to compare conditions and investigate unexpected results. Specify those operating requirements alongside the sensors so the installed NiuBoL system supports the decisions for which it was purchased.
Prev:Wireless Weather Station Architecture: Shared Gateways or Independent Sites
Next:Remote Rain Gauge: Sensor Limits, Rainfall Records and Field Checks
Related recommendations
Sensors & Weather Stations Catalog
 Agriculture Sensors and Weather Stations Catalog-NiuBoL.pdf
Weather Stations Catalog-NiuBoL.pdf
Agriculture Sensors Catalog-NiuBoL.pdf
Water Quality Sensor Catalog-NiuBoL.pdf
Related products
 Combined air temperature and relative humidity sensor
 TDR Soil Moisture & Temperature Sensor for irrigation| RS485 |4-20mA| NBL-S-THR
 Soil pH sensor RS485 soil Testing instrument soil ph meter for agriculture |NBL-S-PH
 Wind Speed sensor Output Modbus/RS485/Analog/0-5V/4-20mA
 Tipping bucket rain gauge for weather monitoring auto rainfall sensor RS485/Outdoor/stainless steel
 Pyranometer Solar Radiation Sensor 4-20mA/RS485


Screenshot, WhatsApp to identify the QR code
WhatsApp number:+8615367865107
(Click on WhatsApp to copy and add friends)

