





— Blogs —
—Products—
 Consumer hotline +8618073152920
WhatsApp:+8615367865107
Address:Room 102, District D, Houhu Industrial Park, Yuelu District, Changsha City, Hunan Province, China
Product knowledge
Time:2024-12-17 15:10:52 Popularity:3393
Hydrology telemetry is the remote collection and transmission of water-related observations. Its usefulness depends on when a sensor measures, what the logger retains and when the receiver gets the record. Sampling, recording and uploading are separate operations. Specify them individually so short events are not lost between transmissions or misdated as new observations when delayed data arrive.
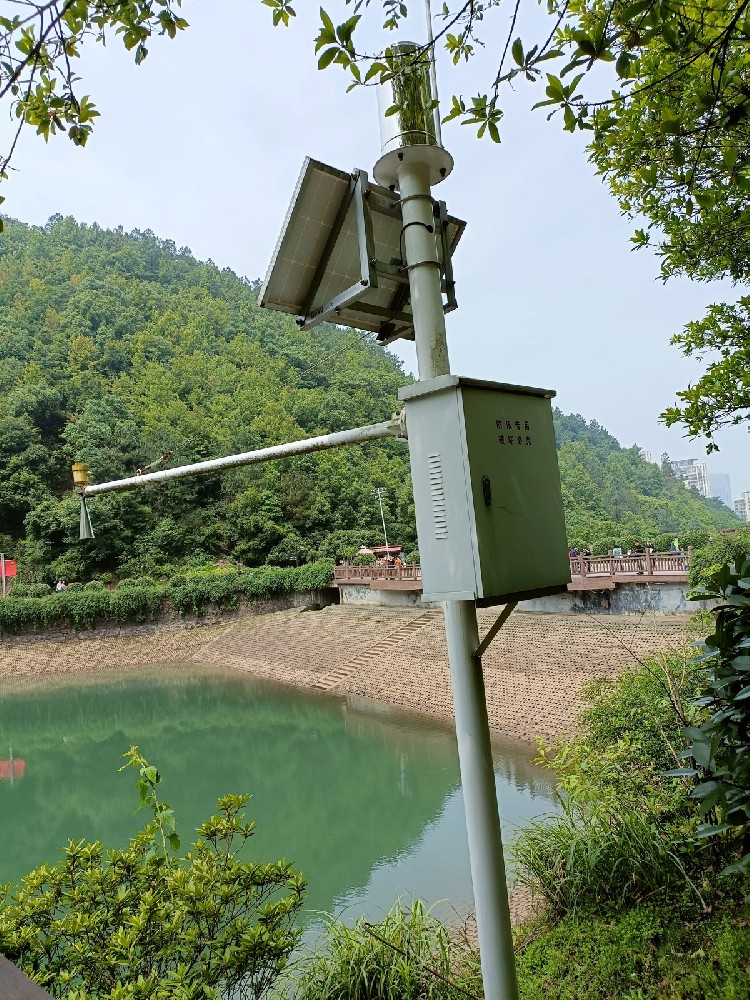
A field sensor measures rainfall, level, velocity or another defined quantity. A logger or RTU reads the instrument, attaches the required identity and time information, and retains or processes the observation. A communications link transfers records to the receiving application, where staff or software interpret them.
Each stage has a different role. A cellular modem does not measure water, and a chart does not establish measurement accuracy. A telemetry system can support reservoir operation, groundwater studies, catchment research or flood monitoring, but those applications still require suitable methods and responsible interpretation.
| Time-related setting | Meaning | Question for the project |
|---|---|---|
| Instrument measurement or response | How the sensor produces its output | Can the instrument resolve the change being investigated? |
| Logger polling | When the receiver requests or reads the sensor | What happens between reads, and is a cumulative quantity retained? |
| Recording or aggregation | Which values or statistics become stored observations | Are raw readings, interval totals, extremes or averages retained? |
| Upload and delivery | When records are transmitted and become available remotely | What delay is acceptable for the intended use? |
Calling all four settings real-time hides the important differences. Ask for the actual intervals and record definitions. A one-minute display refresh does not prove one-minute field measurements, and a sensor's rapid internal sampling does not establish the station's upload rate.
Consider an illustrative station that records one observation each minute and uploads every fifteen minutes. It creates 1,440 observation times per day and 96 scheduled upload opportunities. An upload may carry the intervening records, or only the latest value, depending on the configured software. These are different datasets despite the same communication interval.
If only the latest reading is kept, a short level peak can disappear between uploads. If all readings are retained, the event can remain available for later analysis even though remote users saw it late. Actual delivery also depends on the network. Neither arrangement should be described as an immediate operational warning without checking the full delay.
The trend illustrations below show why a plotted line needs a record definition. The visual shape alone does not identify whether it represents instantaneous readings, averages or retained extremes. Require the export format and aggregation rules rather than infer them from the dashboard.
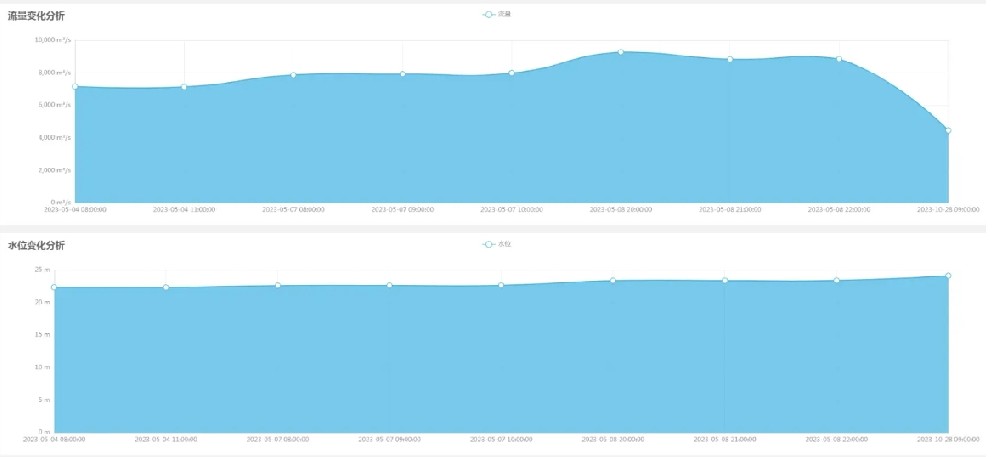
For level, retain a measurement reference and the relevant observation time. Averages can reduce short fluctuations but may also hide an important maximum. If a project needs extremes, state how they are detected and stored; do not assume the logger supplies them merely because it can display a trend.
For rainfall, distinguish counted tips, interval depth and a cumulative total. A logger may read a cumulative register less often without losing the accumulated depth, yet still lose information about event timing. A pulse counter must capture events at its input rather than occasionally inspect an instantaneous contact state.
For flow records, distinguish velocity from discharge and net from gross volume where direction matters. Calculated discharge depends on the appropriate geometry or relationship as well as the sensor. Keep the method with the record instead of naming every hydrological channel water level.
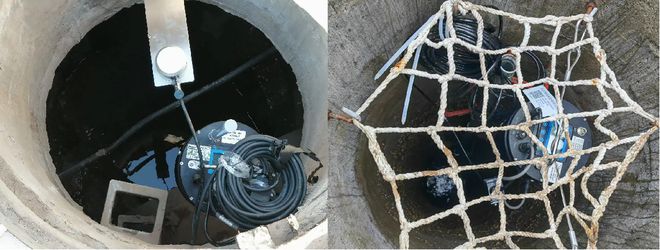
A groundwater reading acquired before a network interruption may arrive afterwards. Its measurement time remains the earlier time. Store arrival time separately where it is useful for assessing delay. Otherwise a delayed batch can appear to describe present conditions, creating a misleading operational picture.
Agree the time zone, clock source and handling of clock corrections. Where channels are compared across sites, check whether their times refer to an instant, the start of an interval or its end. Two records marked 10:00 can represent different periods. A common clock format alone does not make them equivalent.
An event mode might request shorter recording intervals or send a message when a valid threshold is crossed. Specify the condition, persistence, return to normal and behavior when the sensor is unavailable. Test the software implementation rather than assume every logger can perform the same logic.
An accelerated upload cannot recover a peak that the sensor or logger never observed. It can also increase power and communication demand. Assess the complete mode change, including time spent waiting for a connection and the intended response at the receiving system.
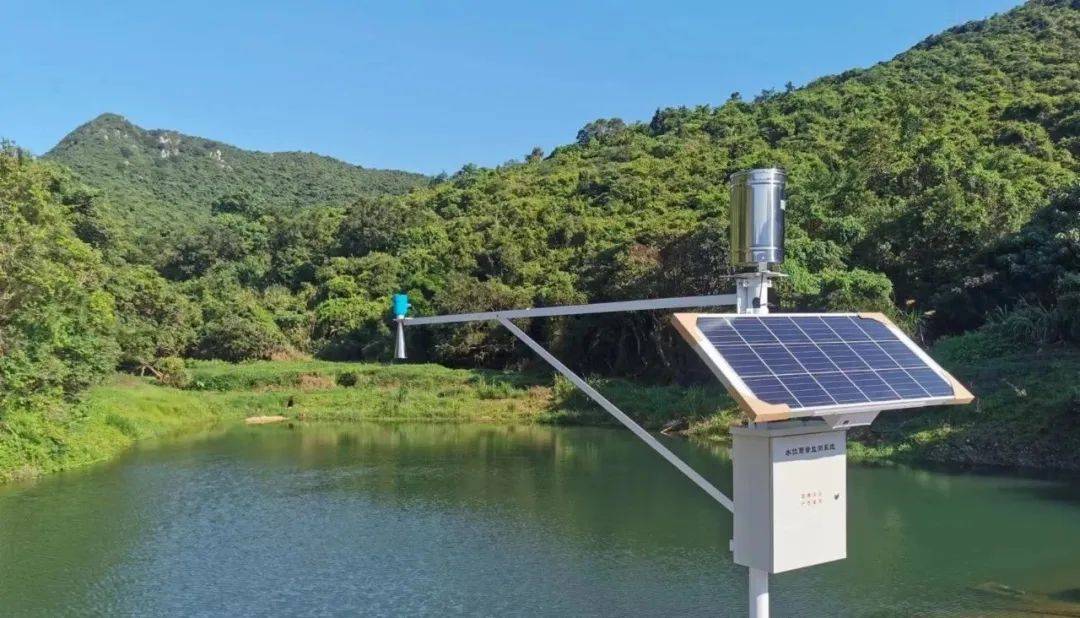
The NiuBoL TG462 and TG462S data loggers provide interfaces for compatible meteorological and hydrological instruments. Their hardware can be assessed against a channel list, while the required polling, storage and reporting behavior must be confirmed in the project configuration.
| Hardware item | TG462 / TG462S specification | Design consequence |
|---|---|---|
| RS485 | 3 ports | Check addressing, serial settings and supported register maps; port count is not a universal sensor count |
| Analog acquisition | 8 x 12-bit ADC inputs | Confirm the required current or voltage conditioning and scaling |
| Digital inputs | 4 DI | Confirm pulse-counting behavior for a rain-gauge application instead of assuming every DI is a suitable counter |
| Network and storage | 2 Ethernet ports; Micro SD support up to 32 GB | Specify retention and delivery behavior; storage capacity alone does not guarantee replay after an outage |
| Cellular communication | Regional modem configuration required | Match destination network bands and assess actual site coverage |
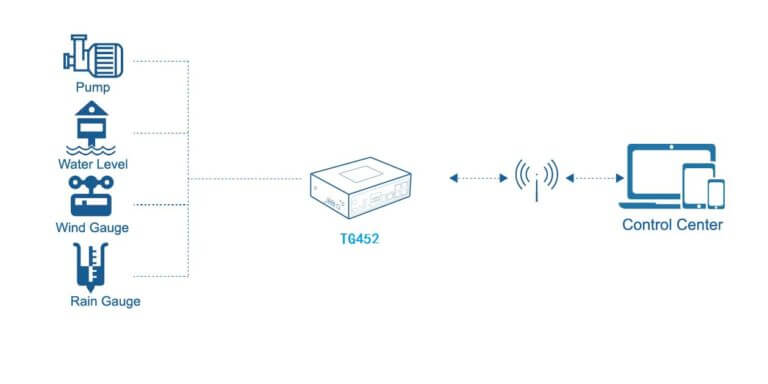
The connection illustration earlier in this article shows a field-to-center architecture. Treat it as a system layout, not a promise that every pictured instrument, gateway generation or software function is included in one order.
The NBL-L-WLPS submersible level transmitter is an example of a compatible RS485 Modbus RTU instrument. Its specified power supply is DC 10-30 V and its maximum consumption is 0.2 W. Select the range and pressure reference for the installation; these figures do not define an end-to-end reporting delay.
For RS485 Modbus RTU acquisition, read the supplied registers with the correct units and scaling. Account for instrument response, polling order, retries, recording and the network path when evaluating availability. A high internal sampling rate must not be advertised as the frequency at which a remote user receives an independent measurement.
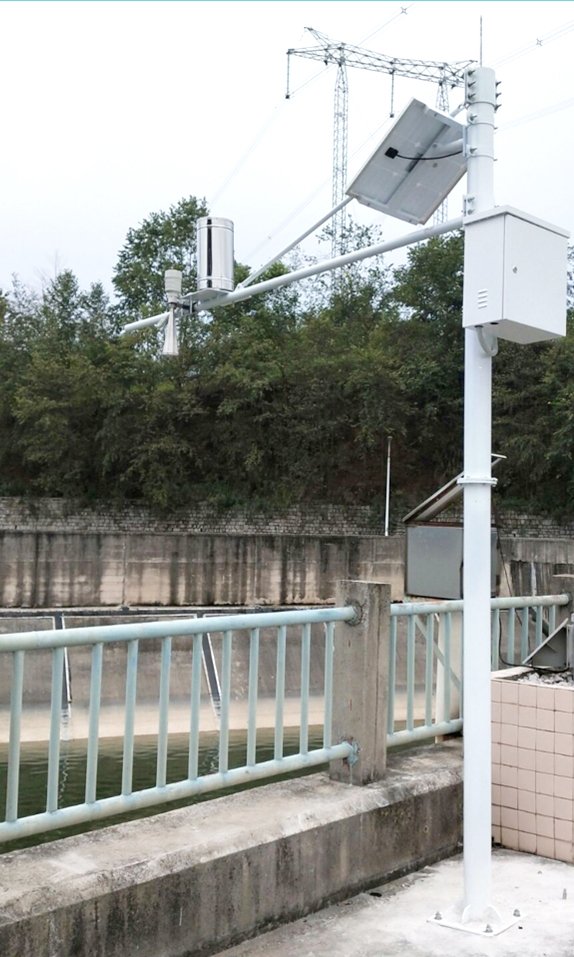
Commission the record path with an identifiable test change or simulated input approved for the instrument. Record when the change was applied, when the logger recorded it and when the receiver made it available. Inspect the exported records as well as the live display. Check retained detail across at least one normal upload cycle.
Then verify what happens when communication is unavailable and restored. The water and rainfall telemetry record-recovery guide covers that separate outage task. Here, the acceptance question is whether each stage follows the agreed sampling, aggregation and delivery rules, including any event mode.
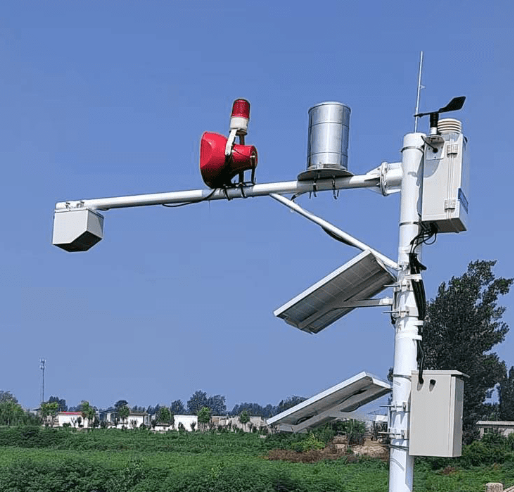
A routine groundwater study may accept delayed delivery while requiring an intact historical series. A rapidly changing channel may need shorter observation intervals and a defined operational response. A reservoir reporting project may need interval totals and agreed daily boundaries. None of these requirements follows automatically from the phrase remote monitoring.
Give NiuBoL the measured quantities, normal and event record requirements, allowable delay and receiving format. Include site power and communication conditions. Separate equipment interfaces from application software and any forecasting or public-warning responsibility so the quotation can address an explicit data service.
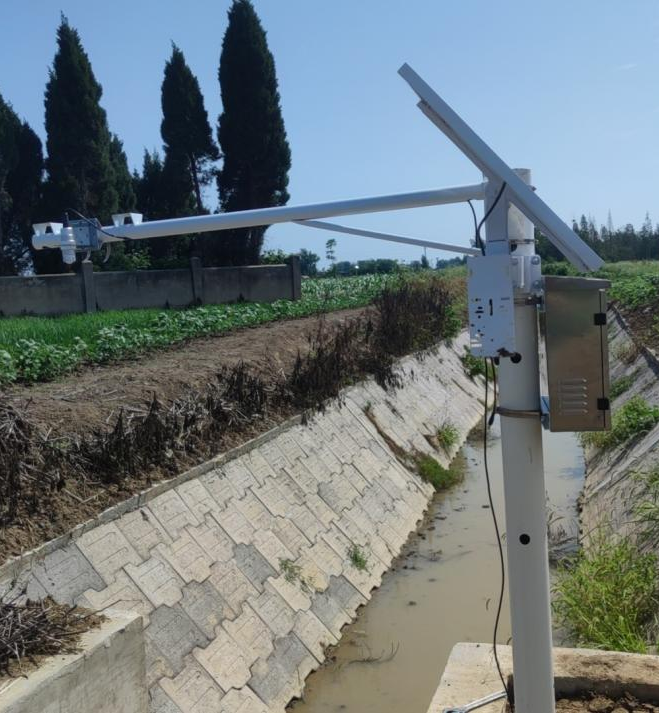
No. A station can measure or record more often than it uploads. Confirm whether each upload contains all intervening records, selected statistics or only the latest value.
It can preserve accumulated depth under the specified reset rules, but infrequent reading may not preserve when that rain occurred. Specify temporal detail separately from the total.
No. Retention, replay, duplicate handling and power-restart behavior depend on configured software as well as hardware capacity. Include them in the acceptance test.
Keep the observation time as the measurement time. Record arrival time separately where needed, and mark delayed observations so they cannot be mistaken for current conditions.
The intended decision and the complete path establish it. Measure from observation through acquisition and transmission to receiver availability, including retries and any event-mode logic.
Hydrology telemetry should deliver records whose quantity, time and availability are understood. Separate sensor response, polling, retained observations and uploads; verify those rules through an actual test. That makes the data useful for its intended monitoring task without treating connectivity as proof of a complete forecasting or warning service.
Prev:Hydrometeorological Hazard Monitoring Tools: Match Instruments to Evidence Gaps
Next:Soil Moisture Sensors for Irrigation: Check Fertigation Effects Before Control
Related recommendations
Sensors & Weather Stations Catalog
 Agriculture Sensors and Weather Stations Catalog-NiuBoL.pdf
Weather Stations Catalog-NiuBoL.pdf
Agriculture Sensors Catalog-NiuBoL.pdf
Water Quality Sensor Catalog-NiuBoL.pdf
Related products
 Combined air temperature and relative humidity sensor
 TDR Soil Moisture & Temperature Sensor for irrigation| RS485 |4-20mA| NBL-S-THR
 Soil pH sensor RS485 soil Testing instrument soil ph meter for agriculture |NBL-S-PH
 Wind Speed sensor Output Modbus/RS485/Analog/0-5V/4-20mA
 Tipping bucket rain gauge for weather monitoring auto rainfall sensor RS485/Outdoor/stainless steel
 Pyranometer Solar Radiation Sensor 4-20mA/RS485


Screenshot, WhatsApp to identify the QR code
WhatsApp number:+8615367865107
(Click on WhatsApp to copy and add friends)

