

— Blogs —
—Products—
 Consumer hotline +8618073152920
 WhatsApp:+8615367865107
Address:Room 102, District D, Houhu Industrial Park, Yuelu District, Changsha City, Hunan Province, China
Product knowledge
Time:2026-05-28 15:59:57 Popularity:322
The supplied material lists conventional water pollution indicators from sensory, physical, chemical, biological and nutrient perspectives. For engineering monitoring, these indicators should not be treated as isolated test items. They form a diagnostic framework for source identification, treatment control and compliance evaluation.
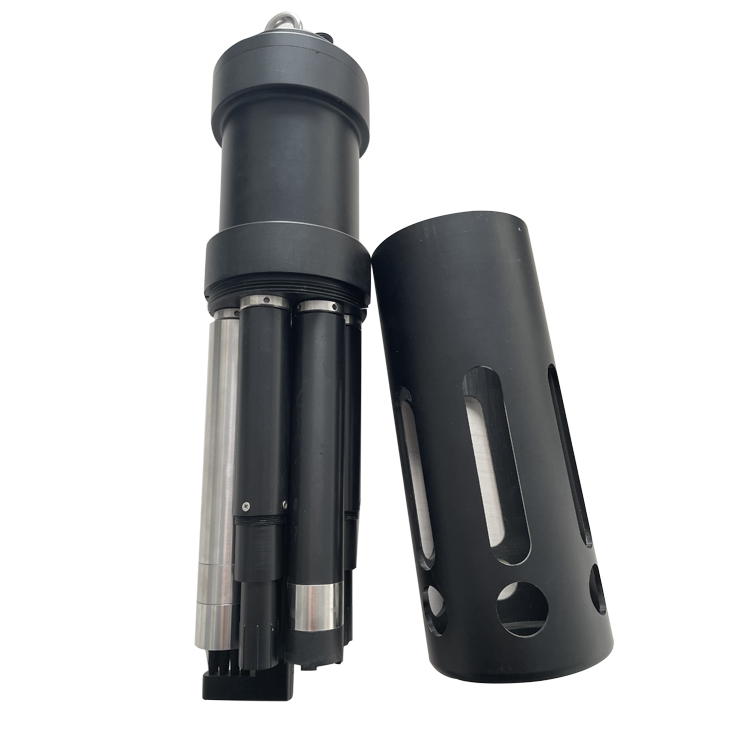
A water quality monitoring system normally places multi-parameter sensors, single-parameter probes and laboratory instruments at different process points. Online sensors provide trend data; laboratory analysis provides confirmation and traceability.
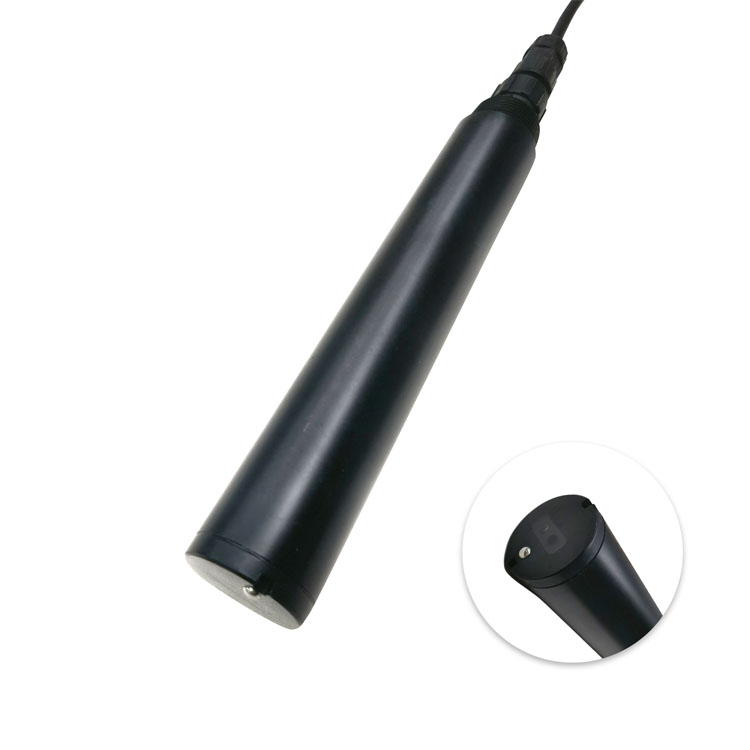
RS485 Modbus RTU is important when indicators must be collected by PLC, DCS, RTU or IoT gateways. The system should define which indicators are online, which are laboratory-confirmed and which trigger alarms.
| Parameter | Engineering specification |
|---|---|
| System type | Online multi-parameter self-cleaning water quality sensor |
| Optional parameters | DO, pH, ORP, conductivity/salinity, turbidity and temperature; other modules such as COD or ammonia nitrogen may be selected by project |
| Communication | RS485 Modbus RTU |
| Cleaning method | Automatic cleaning with configurable interval and cleaning cycles |
| Connector | Waterproof connector for field installation and maintenance |
| Protection structure | Protective guard with slots to reduce damage from large suspended particles and organisms |
| Maintenance | Inspect fouling, clean surface, verify cable, calibrate by single-point or two-point method according to sensor type |
| Indicator | Engineering meaning |
|---|---|
| Odor | Clean water should have no odor; odor indicates pollution or anaerobic condition. |
| Water temperature | Abnormal increase may indicate new pollution or thermal discharge. |
| Turbidity / SS | Reflects suspended matter, clay, organic matter and microorganisms. |
| pH | Abnormal pH indicates acid or alkaline pollution. |
| Conductivity / dissolved solids | Reflects soluble salts and ionic content. |
| TN / ammonia nitrogen / TP | Reflects nutrient pollution and eutrophication risk. |
| DO / BOD / COD | Reflects self-purification, biodegradable organics and chemically oxidizable pollution. |
| Bacteria / coliform | Reflects biological pollution and fecal contamination risk. |
Site environment challenge: organic load and nutrient removal must be controlled together.
System integration scheme: monitor COD, BOD, DO, ammonia nitrogen, TN and TP by online and lab methods.
User value delivered: operators see process load and compliance risk.
Site environment challenge: pollution composition differs by industry.
System integration scheme: select COD, pH, EC, turbidity and specific nutrients according to process.
User value delivered: plants avoid blind monitoring and focus on relevant risks.
Site environment challenge: pollution sources may be intermittent.
System integration scheme: combine DO, turbidity, pH, conductivity and nutrient monitoring.
User value delivered: environmental teams detect abnormal events faster.
Site environment challenge: sensory and biological indicators affect public safety.
System integration scheme: monitor turbidity, pH, conductivity, bacteria risk and nutrients.
User value delivered: water utilities obtain early warning data.
Accuracy selection: Choose the range and precision according to the control purpose, not only the nominal parameter name.
Communication selection: Use RS485 Modbus RTU when data must enter PLC, DCS, SCADA, RTU or industrial IoT platforms.
Installation environment selection: Confirm representative flow, fouling risk, maintenance access, cable route and immersion condition before ordering.
Power supply selection: Standardize cabinet supply voltage and reserve surge, grounding and waterproof protection for outdoor or wet sites.
The source list includes odor, water temperature, turbidity, pH, conductivity, dissolved solids, suspended solids, TN, ammonia nitrogen, TOC, DO, BOD, COD, bacteria count, coliform and TP. Each indicator points to a different pollution mechanism.
Q1: Why are COD and BOD both needed?
COD reflects chemical oxygen demand, while BOD reflects biodegradable organic load.
Q2: What does DO indicate?
It indicates oxygen condition and water self-purification ability.
Q3: Why monitor TN and TP?
They indicate nutrient pollution and eutrophication risk.
Q4: What does conductivity show?
It reflects soluble salts and ionic content.
Q5: Is odor a technical indicator?
It is a sensory indicator that can signal pollution or anaerobic decomposition.
Q6: Can all indicators be online?
Some can be online, while bacteria and certain lab indicators may require laboratory confirmation.
Q7: How should systems be selected?
By pollution source, process objective, required response time and maintenance capacity.
Q8: What protocol helps integration?
RS485 Modbus RTU for online field sensors.
A good engineering solution selects indicators according to pollution risk and process objective. Monitoring everything everywhere is costly; monitoring the wrong parameter is worse.
For environmental monitoring contractors, river/lake station builders, industrial park operators, government project suppliers and IoT water quality platform companies, the real value is not only understanding a water quality parameter. The value is knowing how to turn that parameter into a reliable product selection, a stable project quotation and a monitoring system that customers can maintain after installation.
The common site problem is that single-parameter monitoring cannot explain pollution sources, treatment efficiency or abnormal events clearly enough for engineering decisions. This is why buyers increasingly prefer online sensors, standard communication protocols and supplier support that can connect instrument data with control cabinets, telemetry gateways and cloud platforms.
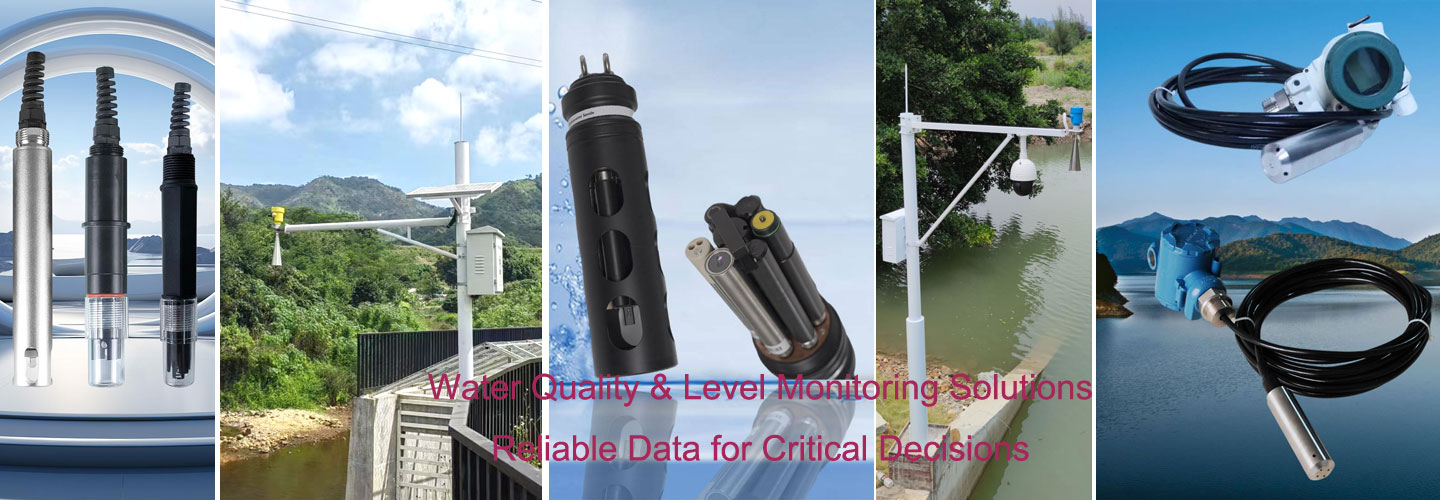
NiuBoL can support this application with NiuBoL multi-parameter water quality sensor portfolio for pollution indicator monitoring. The product value is that it combines COD, BOD, DO, pH, ORP, ammonia nitrogen, conductivity, turbidity, residual chlorine and other indicators into a practical monitoring architecture. For distributors, this creates a clear product story; for system integrators, it provides a practical sensor layer; for end users, it improves monitoring continuity and response speed.
| Buyer question | Practical answer for project selection |
|---|---|
| Who should consider this solution? | environmental monitoring contractors, river/lake station builders, industrial park operators, government project suppliers and IoT water quality platform companies |
| Main operational pain point | single-parameter monitoring cannot explain pollution sources, treatment efficiency or abnormal events clearly enough for engineering decisions |
| Recommended product direction | NiuBoL multi-parameter water quality sensor portfolio for pollution indicator monitoring |
| System value | combines COD, BOD, DO, pH, ORP, ammonia nitrogen, conductivity, turbidity, residual chlorine and other indicators into a practical monitoring architecture |
| When to quote this product | Recommend it when the customer is planning a complete water quality station, wants to compare pollution indicators or needs an integrated monitoring solution. |
1. Engineering project and contractor quotation: River and drainage monitoring stations can use multiple indicators to distinguish organic pollution, suspended solids, salinity change and low-oxygen risk.
2. Industrial or aquaculture operation upgrade: Industrial parks can combine online sensors with telemetry to monitor discharge outlets, pretreatment systems and abnormal wastewater events.
3. IoT and remote monitoring solution: Solution providers can design modular stations by selecting core indicators first, then adding project-specific parameters according to budget and compliance needs.
A professional inquiry should include measuring parameter, expected range, water type, installation method, cable length, power supply, output signal, communication protocol, controller or gateway requirement, and whether the site needs local display, cloud platform, alarm relay or data export.
For RS485 projects, confirm Modbus RTU address planning, baud rate, register mapping, cabinet grounding and surge protection. For 4-20 mA projects, confirm analog input range, cable distance, PLC scaling and field calibration method. For outdoor or pond stations, also confirm waterproof housing, solar power, anti-fouling maintenance and sensor cleaning interval.
| Information needed | Why it matters |
|---|---|
| Application site | Aquaculture pond, wastewater plant, industrial process water, drinking water, river station or OEM equipment. |
| Target parameters | Helps select single-parameter sensors or a multi-parameter monitoring package. |
| Water condition | Temperature, salinity, turbidity, fouling, chemicals and installation depth affect sensor selection. |
| Integration method | RS485 Modbus RTU, 4-20 mA, controller, RTU, PLC, SCADA or cloud platform. |
| Quantity and business role | Dealer stock, project bidding, OEM matching and end-user replacement require different quotation support. |
NiuBoL focuses on practical online monitoring instruments for water quality and environmental sensing. We can support sensor selection, parameter matching, communication integration and project-oriented documentation for distributors, IoT solution companies and engineering contractors.
If you are preparing a quotation, designing a monitoring station or replacing an unstable sensor, send us your water type, required parameter, output signal and installation photos. Our team can help recommend a suitable model and provide product information for your project proposal.
 NBL-WQ-CL Water Quality Sensor Online Residual Chlorine Sensor.pdf
NBL-WQ-DO Online Fluorescence Dissolved Oxygen Sensor.pdf
NBL-WQ-NHN Ammonia Nitrogen Water Quality Sensor.pdf
NBL-WQ-COD Online Water Quality COD Sensor.pdf
NBL-WQ-PH Online pH Water Quality Sensor.pdf
NBL-WQ-EC water quality conductivity sensor.pdf
Prev:Conductivity Electrode Constant Calibration with KCl Solution for Online EC Sensor Accuracy
Next:Nitrogen Forms in Water Quality Analysis: Ammonia, Nitrite, Nitrate and Total Nitrogen Monitoring
Related recommendations
Sensors & Weather Stations Catalog
Agriculture Sensors and Weather Stations Catalog-NiuBoL.pdf
Weather Stations Catalog-NiuBoL.pdf
Agriculture Sensors Catalog-NiuBoL.pdf
Water Quality Sensor Catalog-NiuBoL.pdf
Related products
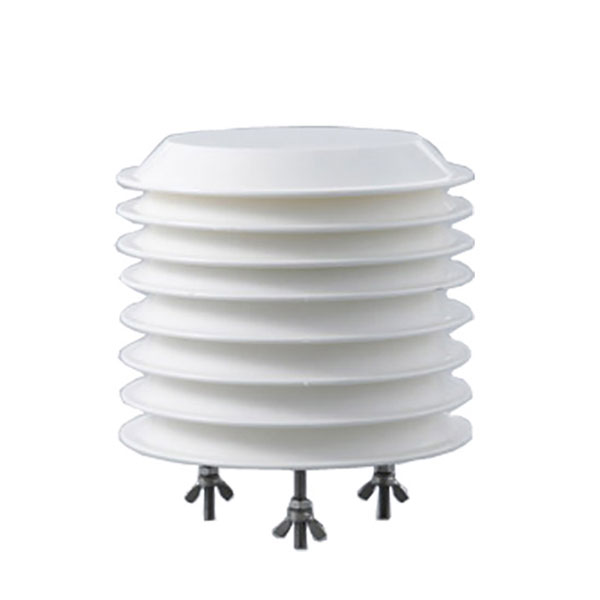 Combined air temperature and relative humidity sensor
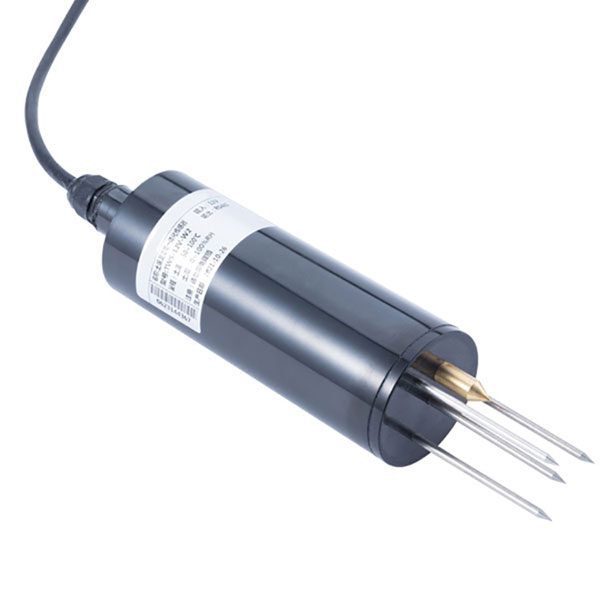 Soil Moisture Temperature sensor for irrigation|NBL-S-THR
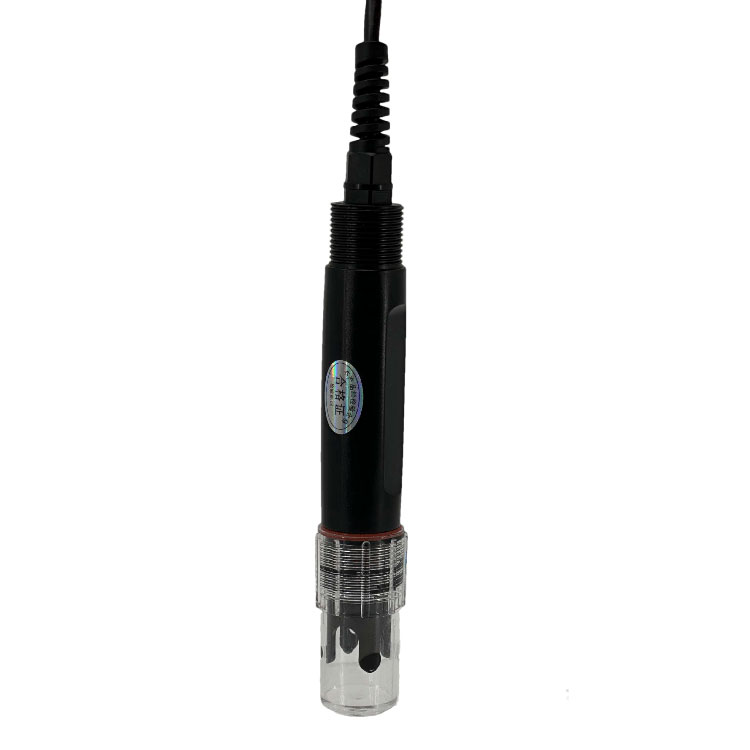 Soil pH sensor RS485 soil Testing instrument soil ph meter for agriculture |NBL-S-PH
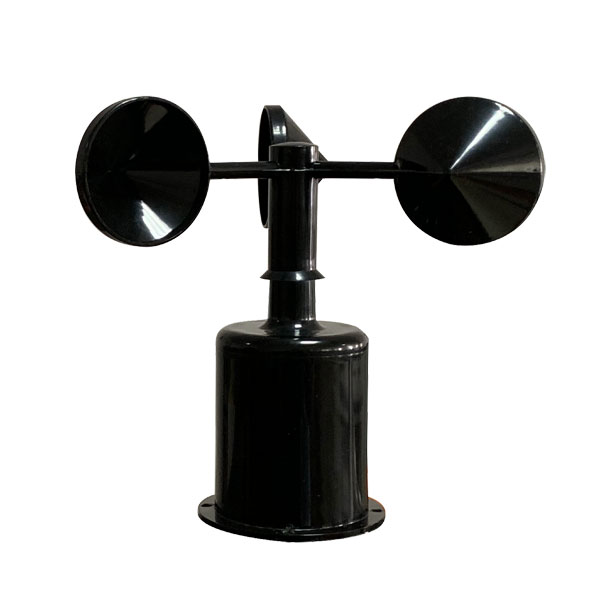 Wind Speed sensor Output Modbus/RS485/Analog/0-5V/4-20mA
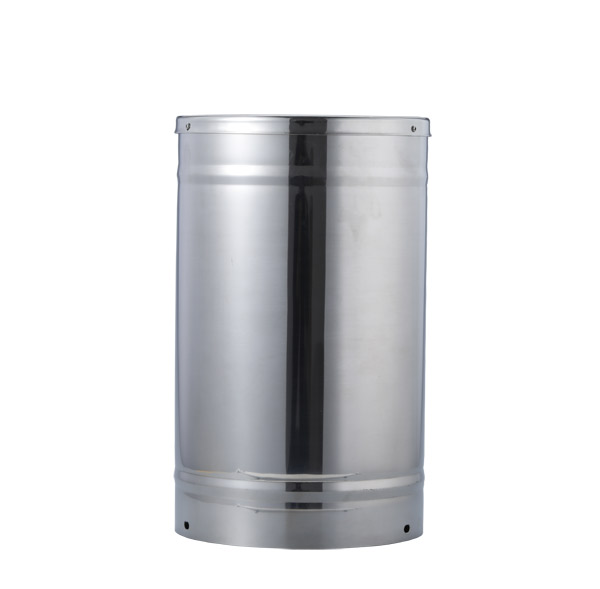 Tipping bucket rain gauge for weather monitoring auto rainfall sensor RS485/Outdoor/stainless steel
 Pyranometer Solar Radiation Sensor 4-20mA/RS485

Screenshot, WhatsApp to identify the QR code
WhatsApp number:+8615367865107
(Click on WhatsApp to copy and add friends)