

— Blogs —
—Products—
 Consumer hotline +8618073152920
WhatsApp:+8615367865107
Address:Room 102, District D, Houhu Industrial Park, Yuelu District, Changsha City, Hunan Province, China
Product knowledge
Time:2026-11-07 15:52:39 Popularity:5
Installing a sensor-based monitoring system is mostly a mechanical and electrical discipline, not a software task. The readings that later get blamed on "sensor accuracy" are usually produced at commissioning: a mast placed too close to a building, an RS485 bus with no common ground reference, or a supply that measures 12 V at the panel and 10.4 V at the probe. A repeatable installation procedure with recorded acceptance values is what makes a network's data comparable across sites.
Start with the measurement objective, because siting requirements differ. Wind and rainfall need open exposure; soil moisture needs a representative root-zone volume; ambient air quality needs a well-ventilated inlet away from local sources. Writing the objective down prevents a single "convenient" pole location from compromising three different measurements.
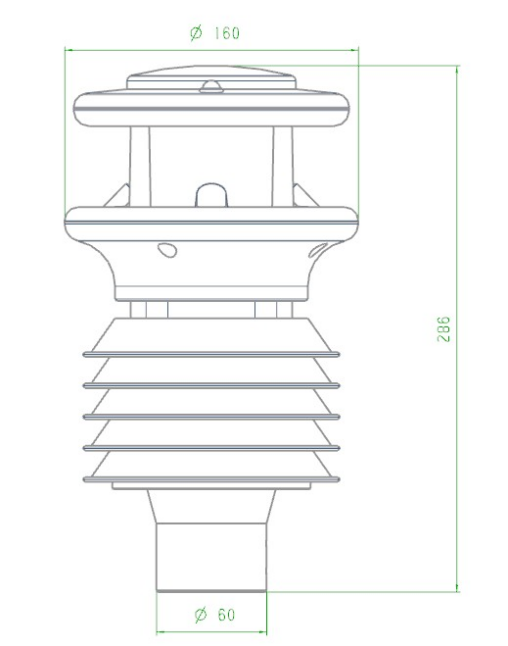
Figure 1. all-in-one ultrasonic weather station sensor dimensions.
For an environmental station, survey and record the following:
NiuBoL's mounting hardware gives a concrete example of the mechanical side. A galvanized steel mast specification lists a 2.0 mm wall thickness and a 76 mm support diameter compatible with standard interface devices. Those are not decorative numbers: wall thickness governs deflection under wind load, and diameter determines whether the intended sensor bracket and radiation shield actually fit. Confirm both on the current accessory drawing before ordering, and record the installed height and orientation in the commissioning sheet.
| Item | Why it is recorded | Typical acceptance question |
|---|---|---|
| Mast wall thickness / diameter | Wind deflection and bracket fit | Does it match the accessory drawing (e.g. 2.0 mm / 76 mm)? |
| Sensor height and orientation | Comparability with other stations | Is it level, and is north alignment documented? |
| Cable length and topology | Bus loading and voltage drop | Is A/B twisted pair, and is the shield earthed once? |
| Supply voltage at device | Undervoltage causes dropouts | Measured at the probe under load, not at the panel |
| Inlet clearance | Local sources bias the sample | Is the inlet outside the wake of walls and vents? |
| Logger storage and resume | Data survives uplink outages | Is local logging and breakpoint resume enabled? |
Mount the mast first, then the sensors. Set the foundation or tripod, plumb the mast, and only then attach brackets. Leveling matters for rainfall, radiation and any channel with a directional sensing element. A mast that is visibly out of plumb produces a rainfall catch that varies with wind direction, which is easy to mistake for a calibration problem a year later.

Figure 2. Weather Station Mounting Bracket.
Keep the signal chain short at the electrometer end. Route sensor cables into a junction enclosure close to the mast, then run a single well-terminated bus back to the logger. Use twisted pair for RS485 A/B, terminate the shield at one deliberate earth point, and keep the cable away from solenoid, pump and mains wiring. A shield earthed at both ends becomes a ground loop; a floating shield becomes an antenna.
Verify supply at the device. NiuBoL's NBL-W-CO2 sensor, for example, is specified at 12–24 VDC with 0.2 W power draw and RS485 Modbus RTU at 9600 baud. The important commissioning step is to measure the voltage at the sensor terminals with the whole bus active. RS485 A/B continuity does not prove adequate supply — a bus can pass Modbus frames quite happily while a marginal supply produces intermittent, temperature-dependent dropouts that look like drift.
Do not give individual RS485 sensors their own modems. Remote communication is normally handled by the data logger or IoT gateway, not by each field device. Individual RS485 sensors do not need their own cellular modem. This separation is useful: local storage and breakpoint resume at the collector preserve the series during an uplink outage; a sensor polled directly from a cloud service loses it.
A commissioning sequence that produces an auditable record is worth more than a quick "it's online" check.
NBL-W-CO2 documentation states a single concentration word in the corresponding read format at 9600 baud, 0–5000 ppm range, ±(50 ppm + 3% of reading) accuracy and 1 ppm resolution. Do not assume additional baud rates or a universal device-count and cable-distance limit — confirm them for the specific installation.01 B4 form hexadecimal 0x01B4, decimal 436, so the concentration is 436 ppm. Reproducing that calculation once during commissioning proves that the logger's scaling, byte order and unit are correct. A frame that decodes to 436 in a handheld tool but 43,600 in the dashboard is a scaling bug, not a sensor fault.NBL-W-CO2 is ±(50 ppm + 3% of reading) — two different conventions that must not be mixed in one specification table.Undervoltage. If a 12 V nominal supply arrives at 10.4 V at the probe, the device may still answer polls but its analogue front end can be out of regulation. A 13% shortfall is invisible in a status dashboard and shows up as a slow, temperature-correlated bias.
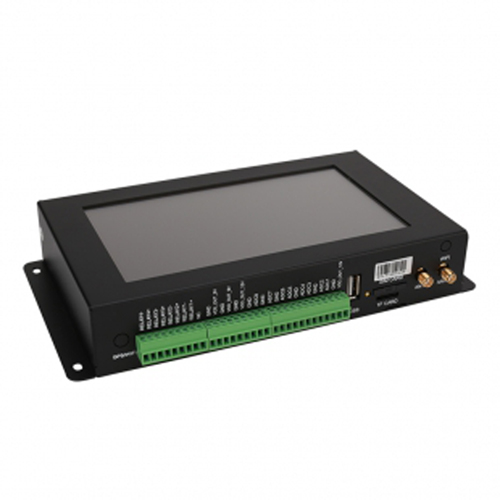
Figure 3. NiuBoL industrial IoT gateway and data logger for environmental monitoring.
Wrong accuracy convention. Confusing ±(40 ppm + 2% F.S) with ±(50 ppm + 3% of reading) changes the expected error at 2000 ppm substantially. The first yields 40 + 40 = 80 ppm; the second yields 50 + 60 = 110 ppm. Quoting the wrong one in an acceptance test will fail a healthy instrument or pass a faulty one.
Ground loops. A shield connected at both ends can inject tens of millivolts of common-mode noise into an already small signal. The symptom is a reading that tracks pump or valve switching rather than weather.
Thermal siting error. A temperature/humidity probe mounted over asphalt or against a sunlit wall reads a microclimate, not the site. An offset of several °C against a properly sited reference is common and is not fixable by calibration.
Wake effects. A wind sensor sited within the disturbed airflow of a building or tree line reports a direction-dependent bias. Because it varies with wind direction, it will not be removed by a single zero adjustment.
Inlet obstruction. NiuBoL's air quality sensor guidance specifies mounting in open, well-ventilated areas with unobstructed sensor inlets. An inlet under a canopy or against a wall changes the sample air and the response time together.
Missing local buffering. A logger without local storage and resume turns a two-hour cellular outage into a permanent two-hour hole. NiuBoL's industrial collector specification lists 128 GB storage and breakpoint resume transmission; enable and test both before handover.
Commissioning proves the installation on one day; a trend log proves it over a season. For the first 30 days, keep four series alongside the measurement data: zero offset from each capped-inlet check, supply voltage measured at the device under load, the count of missing polls per day, and the clock offset between logger and platform. These are project-defined diagnostic thresholds, not NiuBoL specifications — set the alert levels from the first week's own baseline rather than from a generic number.
A worked example shows why the distinction matters. Suppose the zero offset rises from 0.2% to 0.9% of full scale over three weeks while supply at the probe falls from 12.1 V to 11.6 V and missing polls increase from 0 to 4 per day. Read separately, each looks minor. Read together, they describe a supply or connector problem that will eventually become a data gap. If the measurement channel had drifted by the same amount without any change in the other three series, the more likely explanation would be element ageing or fouling, and the response would be a cleaning and span check rather than an electrical inspection.
Record cleaning dates with before-and-after zero readings. A probe whose offset returns to baseline after cleaning has a contamination problem and needs a shorter cleaning interval; one whose offset does not move needs a calibration or hardware review. Keep the raw values, the quality flags, the firmware version and the datasheet revision together. When a client asks a year later whether an exceedance was real, the audit trail — not the dashboard — is what answers the question.
Finally, re-run one hand-decoded Modbus frame after any firmware or configuration change. A register map revision that silently changes scaling produces a plausible-looking step change across every channel, and the only reliable defense is a repeatable decode check tied to a documented datasheet revision.
Q1. Does every RS485 sensor need its own SIM card?
No. Remote communication is normally handled by the data logger or gateway. Individual RS485 sensors do not need their own cellular modem.
Q2. Why does the dashboard show a value ten times the handheld tool?
Almost always a scaling or byte-order mismatch in the register decoding. Decode a raw frame by hand — the NBL-W-CO2 example of 01 B4 → 436 ppm is a good template — before suspecting the sensor.
Q3. Can I check RS485 wiring by measuring continuity only?
No. A/B continuity proves the wire, not the supply or the common-mode conditions. Measure voltage at the device with the bus active and check shield termination.
Q4. How do I compare accuracy across two CO₂ specifications?
Convert them to the same basis. ±(40 ppm + 2% F.S) and ±(50 ppm + 3% of reading) give different errors at the same concentration; never mix the conventions in one table.
Q5. What belongs in a commissioning record?
Address, baud, raw frame decode, supply at device, zero offset, reference reading, time sync result, firmware and datasheet revision, plus the siting survey.
Q6. How often should the physical installation be rechecked?
After any severe weather, cable work or sensor replacement, and on the interval established by your own zero-drift and visual-inspection findings.
Prev:Soil Moisture Sensors in the Field: Placement, Telemetry and a Worked Irrigation Example
Next:How a Sensor Turns a Physical Change Into a Signal: Principles, Specs and Error Sources
Related recommendations
Sensors & Weather Stations Catalog
 Agriculture Sensors and Weather Stations Catalog-NiuBoL.pdf
Weather Stations Catalog-NiuBoL.pdf
Agriculture Sensors Catalog-NiuBoL.pdf
Water Quality Sensor Catalog-NiuBoL.pdf
Related products
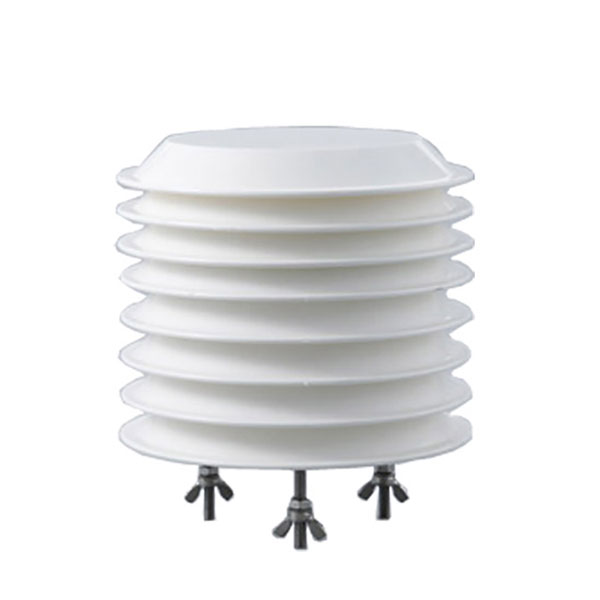 Combined air temperature and relative humidity sensor
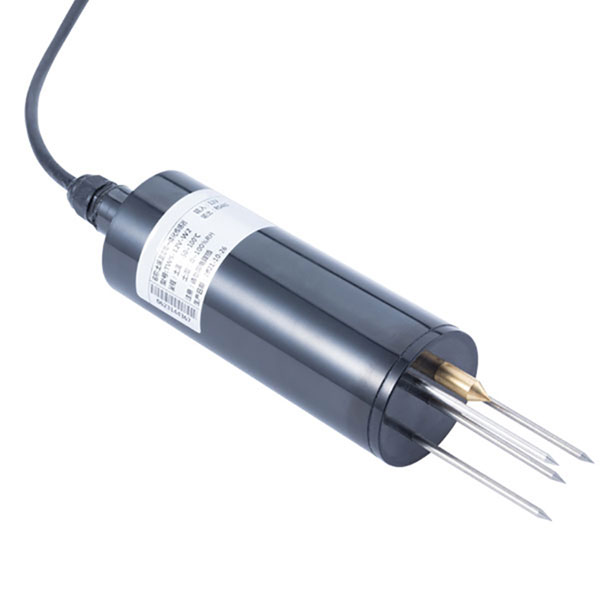 TDR Soil Moisture & Temperature Sensor for irrigation| RS485 |4-20mA| NBL-S-THR
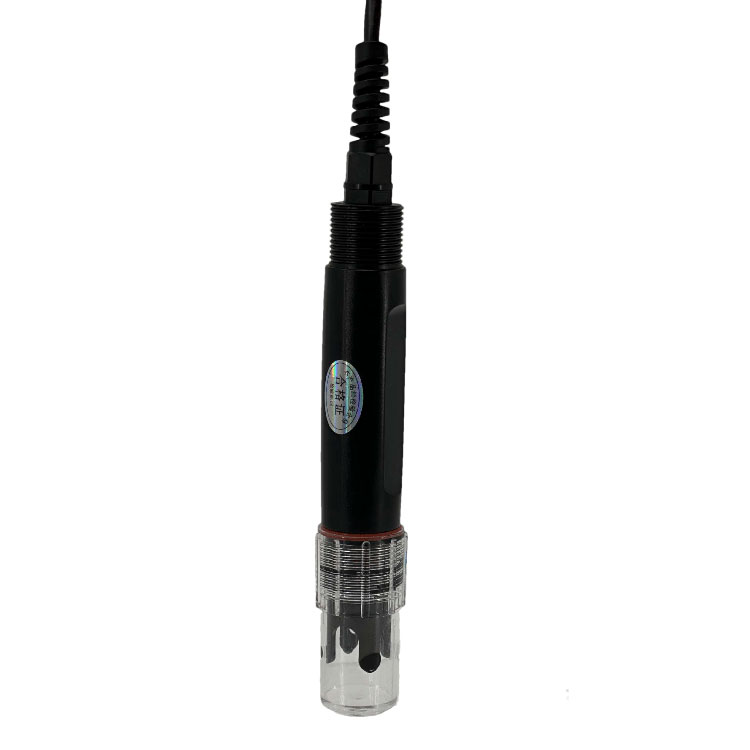 Soil pH sensor RS485 soil Testing instrument soil ph meter for agriculture |NBL-S-PH
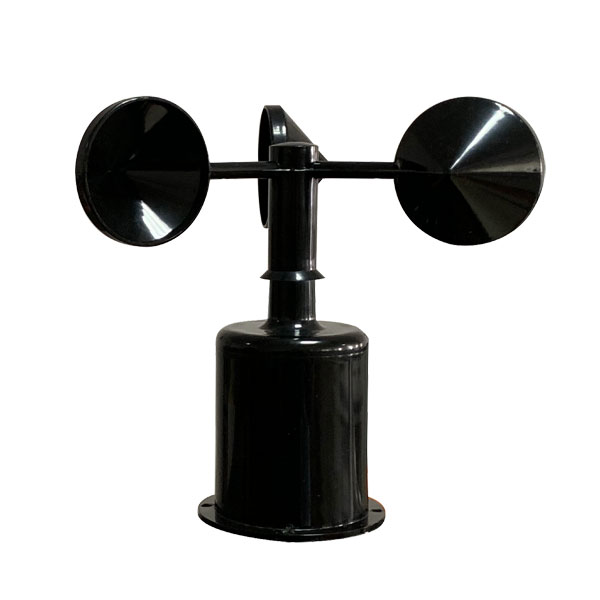 Wind Speed sensor Output Modbus/RS485/Analog/0-5V/4-20mA
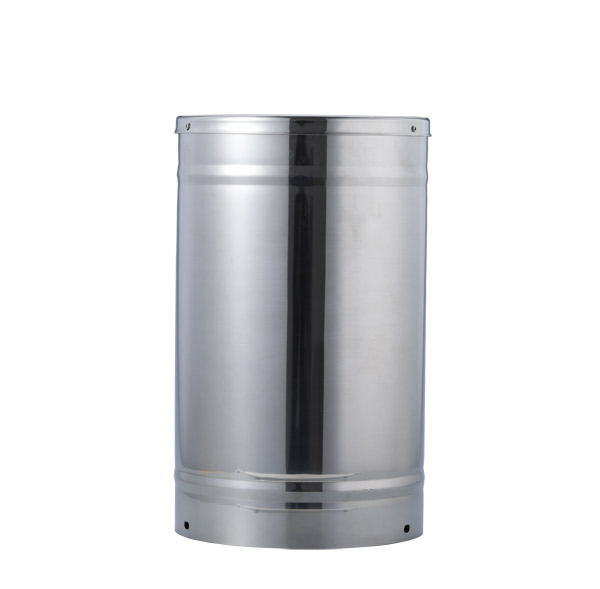 Tipping bucket rain gauge for weather monitoring auto rainfall sensor RS485/Outdoor/stainless steel
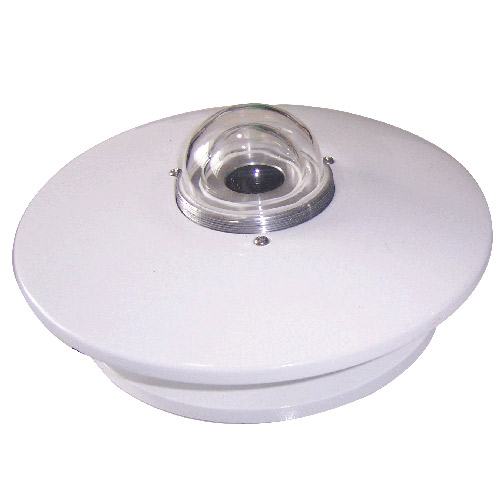 Pyranometer Solar Radiation Sensor 4-20mA/RS485

Screenshot, WhatsApp to identify the QR code
WhatsApp number:+8615367865107
(Click on WhatsApp to copy and add friends)