

— Blogs —
—Products—
 Consumer hotline +8618073152920
WhatsApp:+8615367865107
Address:Room 102, District D, Houhu Industrial Park, Yuelu District, Changsha City, Hunan Province, China
Product knowledge
Time:2026-09-17 15:00:00 Popularity:205
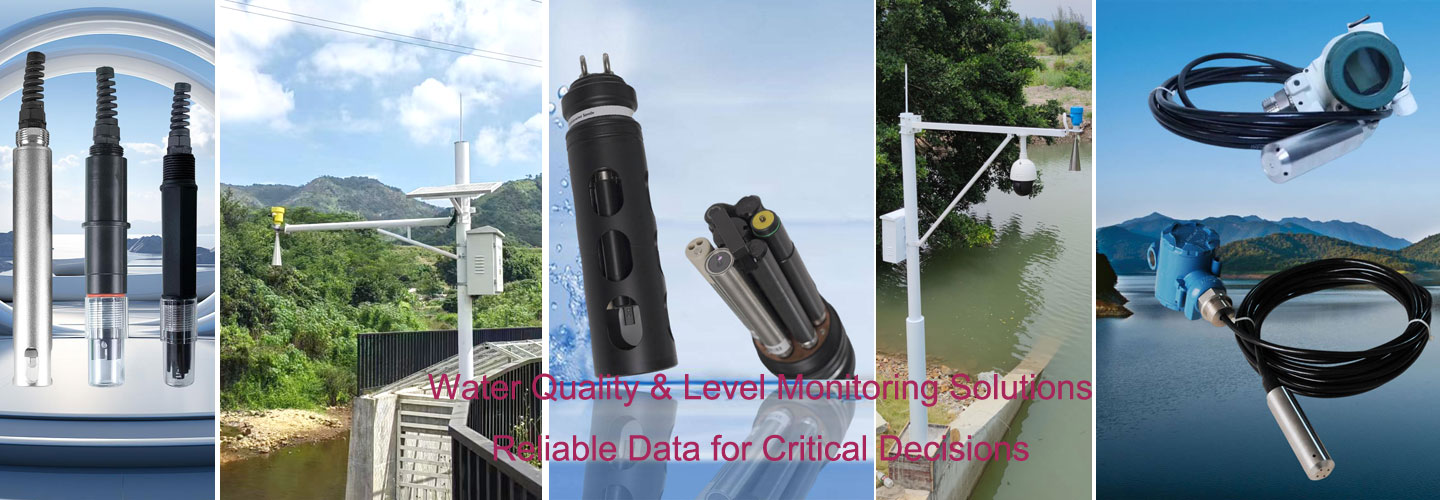
An online water quality monitoring system structure defines how a measurement becomes a usable record: the sensor measures the water, a controller or data logger reads and checks the result, a communication device transfers it, and a platform stores and presents it. The important design question is what happens between those functions. Units, timestamps, missing data and alarm responsibility must remain clear when equipment from different suppliers is connected.
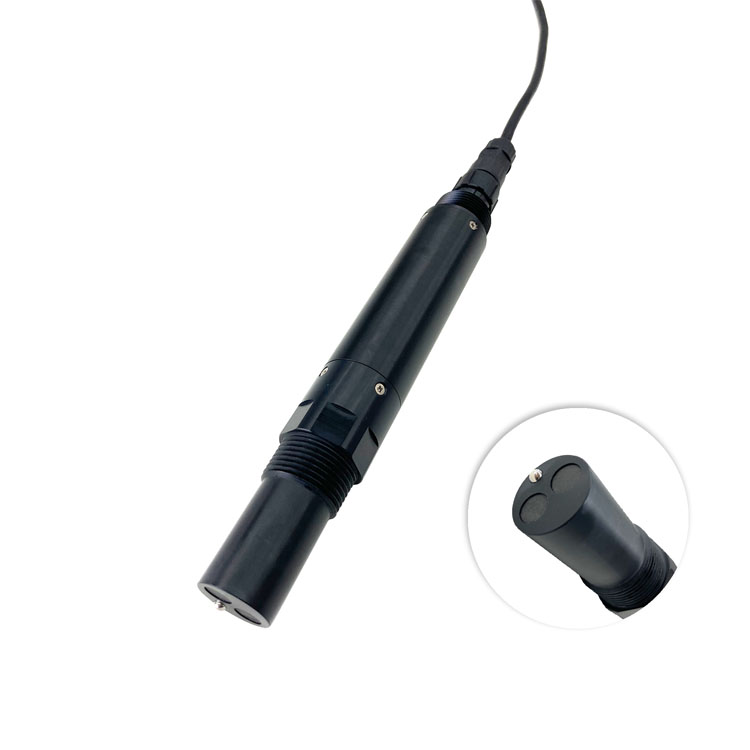
Start with a drawing of the water path and a separate drawing of the data path. A neat network diagram cannot show whether a probe is measuring stagnant water. Conversely, a correctly installed conductivity sensor can produce misleading reports if the host confuses uS/cm with mS/cm or strips away its temperature-compensation setting.
The conductivity probe pictured above represents the measurement end of the system. It does not establish the capabilities of the logger, cellular connection or reporting software. Allocate each function to an actual device, then test the connections between devices. Combining several functions in one enclosure is acceptable, provided their behavior remains identifiable.
| Interface | Information that must cross it | A useful acceptance test |
|---|---|---|
| Water to sensor | Representative exposure, flow or immersion condition, instrument status | Compare a sample from the actual measuring point with a suitable reference |
| Sensor to local host | Value, unit, scaling and available diagnostics | Compare the decoded register value with the local instrument reading |
| Host to remote platform | Measurement time, point identifier, quality flag and sequence information | Disconnect the uplink and inspect what is retained and retransmitted |
| Platform to operator | Current condition, age of data, alarm location and required response | Trigger a test event and confirm that the correct person receives it |
A platform connection should not erase differences between analytical methods. For example, an optical BOD estimate must remain distinguishable from a laboratory BOD5 result. They may be displayed together for a site-validated comparison, but assigning both to a generic BOD database field can create a false impression of agreement or contradiction.

A remote trend dashboard can tolerate a temporary upload delay if records are retained and later recovered. A process action may not tolerate waiting for a public network. Decide which alarms and controls belong in the local PLC or controller, and which are notifications or reports handled remotely. Do not give a cloud chart responsibility for a local action that it cannot perform during an outage.
For a monitoring-only station, the local host still needs enough intelligence to distinguish a fresh reading from a cached value. For a control application, it also needs the approved response to an invalid measurement. The response is process-specific: holding an output, inhibiting an action or requiring operator review are different choices, not interchangeable default settings.
A gateway may only forward serial traffic, or it may poll instruments, decode registers, buffer records and publish data. Those are separate capabilities. Ask for a demonstration of the required mode. An Ethernet or cellular connection does not prove that the device has a Modbus master function, a persistent queue or an exportable historical database.
RS485 describes the electrical connection; Modbus RTU defines serial messages. Neither supplies a universal water-quality register map. Agree the model-specific addresses, data types, scaling and units with the receiving host. The same register number on two different instruments can represent different values, and a sensor replacement may require a revised map even if its connector is unchanged.
Use one polling master on a conventional Modbus RTU bus. If a PLC already reads the probes, obtain data for the remote system from an appropriate PLC interface or designed gateway arrangement. Connecting a second independent master to the same serial pair is not a dependable way to add remote monitoring. Separate buses can also isolate devices with incompatible serial settings.
Estimate polling time from a bench test that includes normal replies and timeouts. A disconnected instrument that is retried repeatedly can delay every other instrument on a shared bus. Verify that healthy channels remain timely during a single-device fault. Increasing baud rate is not a substitute for correcting timeout handling or an unsuitable cable layout.
The suspended-solids probe below illustrates another mapping requirement: retain the concentration unit and calibration relationship used by that instrument. A TSS mass concentration should not be placed into a turbidity tag merely because both channels describe particles. A common platform can combine these records without making the underlying measurements equivalent.

A practical record contains a stable point identifier, parameter name, value, unit, acquisition time and validity status. Retain the receiving time separately when delayed uploads are possible. If a batch arrives after a network outage, the original measurement time should remain visible rather than making hours of historical data appear to have been measured at reconnection.
Define whether a logged value is an instantaneous sample, a mean, a minimum or a maximum. A five-minute mean can conceal a brief turbidity excursion even though the sensor detected it. Where short events matter, retain an appropriate event record or interval extremes alongside the average. The display interval and the instrument's acquisition interval need not be identical.
Use explicit flags for maintenance, missing communication and out-of-range values. Do not encode all three as zero. Preserve raw or minimally processed records when applying corrections or calculations, and record the configuration version used. This lets an engineer investigate a trend discontinuity after an electrode replacement without guessing whether the water or software changed.
Storage capacity should be calculated rather than described as unlimited. An illustrative station storing eight channel records every minute produces 11,520 records per day. At an assumed 100 bytes per record, that is about 1.15 MB daily before indexes, file overhead and backups. Thirty days would require about 34.6 MB for those records alone. Actual software and transmission overhead must be measured separately.
A multi-parameter package fits an online water quality system when the channels can share sample presentation, controller, power, communications and service access. Parameters that require different flow, reagents or maintenance conditions may need separate analyzers even when their data appears on the same platform.
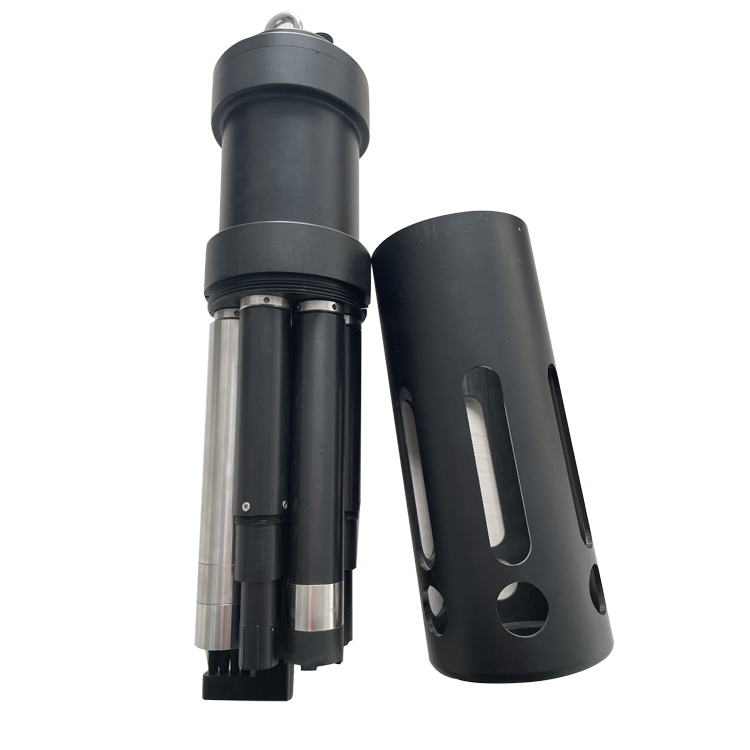
The NiuBoL NBL-WQ-MPS-5A can combine a selected set of up to eight parameters including temperature. It is a field measurement assembly, not an internet-connected station by itself. The controller still needs to read the configured channels correctly, and the project still needs a suitable mounting point and a way to recover the probe for service.
| MPS-5A detail | Technical value | Architecture consequence |
|---|---|---|
| Available channels | Selected DO, COD, pH, ORP, conductivity/salinity, ammonia nitrogen and turbidity, with temperature | Specify the fitted set; do not create active platform tags for absent channels |
| pH option | 0-14 pH; accuracy +/-0.1 pH; resolution 0.01 pH | Preserve the unit and channel identity through database exports |
| Conductivity options | 0-5000 uS/cm or 0-200 mS/cm; accuracy +/-1.5% FS | Store the selected range and unit with the configuration |
| Supply and consumption | 12 V DC +/-5%; 5 W at 12 V | Use a suitable regulated branch rather than connecting directly to an arbitrary panel voltage |
| Output and cable | RS485 Modbus RTU; 5 m standard four-core twisted-pair shielded cable | Plan the serial connection and any extension before installation |
| Cleaning and mechanical support | Configurable automatic cleaning; lifting ring or 4 NPT mounting | Mark service periods and support the assembly independently of its cable |
Check protection, pressure, temperature and wetted-material requirements for the assembled configuration. Do not transfer a component probe's IP rating or operating limit to every part of the station. The outdoor cabinet, immersion assembly, cable joints and modem may each require different environmental protection.
No. A compatible local host can collect multiple channels and use one uplink. Separate gateways may be justified by distant locations, incompatible interfaces or fault-isolation needs. Decide from cable routes, polling performance and outage consequences, not from the number of parameters shown on the dashboard.
During a controlled test, interrupt the remote connection while local acquisition continues. Restore it and compare the local log with the platform by timestamp and point identifier. Check for missing records, duplicates and overwritten values. Confirm whether the buffer survives a power restart as well as a network interruption.
Yes, where the selected sensor or interface provides the required analog output. Account for one measured variable per conventional current loop, configured range and fault indication. An RS485-only probe cannot be connected directly to an analog input. Any converter must be specified and tested as another part of the measurement path.
A displayed red icon is insufficient. Apply a controlled test input and confirm the value, timestamp, threshold evaluation, notification recipient and acknowledgement. Test stale data separately from a high valid reading. Verify local behavior when the platform is unavailable before relying on remote notification for an operating response.
The owner needs the tag list, register mapping, controller configuration and a usable data-export method, plus the permissions required to maintain them. Record who manages connectivity subscriptions and platform accounts. Demonstrate an export with units and quality flags intact; a screenshot cannot replace an accessible measurement record.
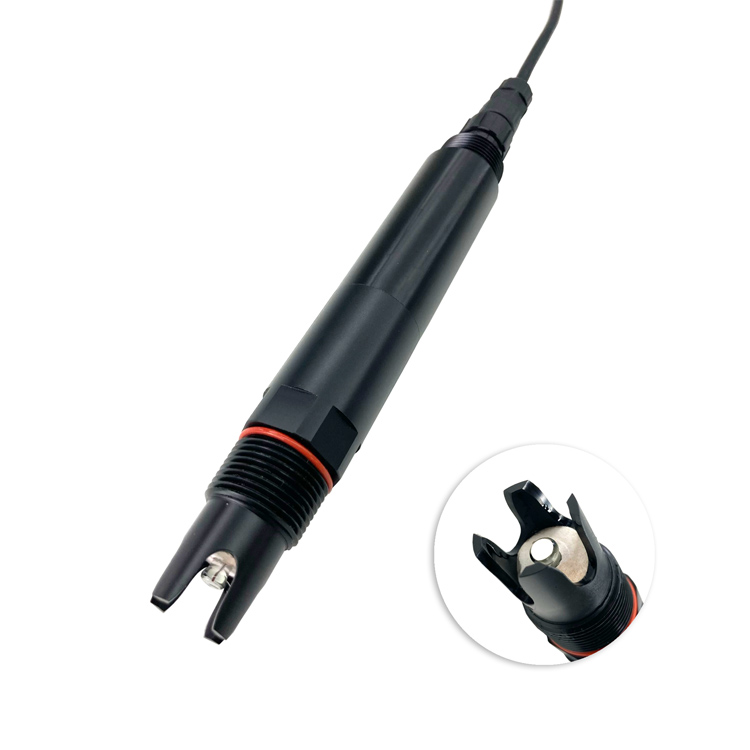
Give each new measuring point a distinct identifier and test it outside the live alarm path first. Do not reuse an old pH tag for another parameter. Check serial loading, power capacity and database mapping before activation, then compare existing channels before and after the addition. A separate pH probe, such as the one below, can remain on the same platform while measuring a different location.
Send the number and location of measuring points, required channels, existing host interfaces and an example of the platform's expected data format. Specify local alarm requirements and the tolerated upload outage. This allows the sensor and communication interfaces to be evaluated against an actual integration task rather than an unspecified request for cloud connectivity.
A workable online water quality monitoring system structure preserves the meaning and timing of each reading from water to operator. Test the interfaces with faults as well as normal values, and make storage, alarm and control responsibilities explicit. NiuBoL sensors can form the measurement layer; successful integration depends on proving that the receiving system uses those measurements correctly.
Prev:Fish Pond Ammonia Nitrogen Monitoring Range and Alarm Selection Guide
Next:Tap Water Online Quality Monitoring System: Pump-Room Retrofit
Related recommendations
Sensors & Weather Stations Catalog
 Agriculture Sensors and Weather Stations Catalog-NiuBoL.pdf
Weather Stations Catalog-NiuBoL.pdf
Agriculture Sensors Catalog-NiuBoL.pdf
Water Quality Sensor Catalog-NiuBoL.pdf
Related products
 Combined air temperature and relative humidity sensor
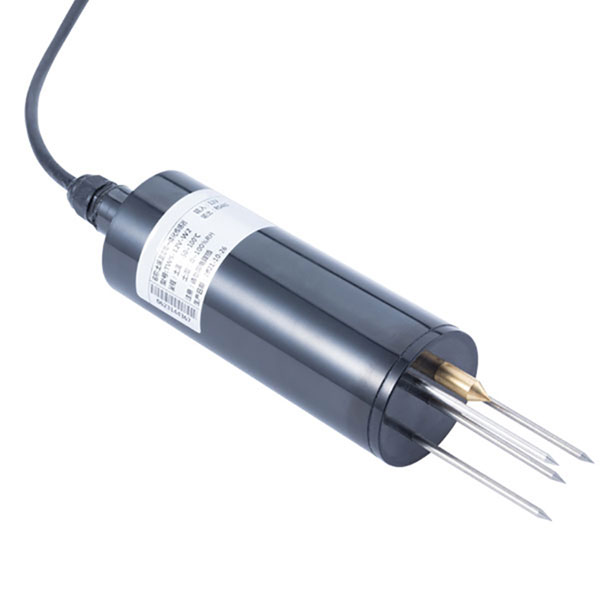 TDR Soil Moisture & Temperature Sensor for irrigation| RS485 |4-20mA| NBL-S-THR
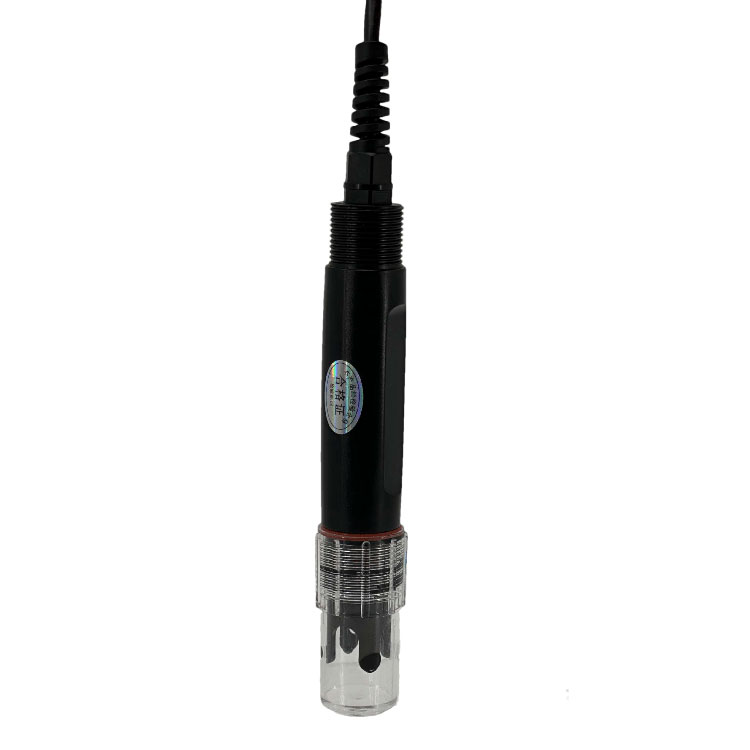 Soil pH sensor RS485 soil Testing instrument soil ph meter for agriculture |NBL-S-PH
 Wind Speed sensor Output Modbus/RS485/Analog/0-5V/4-20mA
 Tipping bucket rain gauge for weather monitoring auto rainfall sensor RS485/Outdoor/stainless steel
 Pyranometer Solar Radiation Sensor 4-20mA/RS485

Screenshot, WhatsApp to identify the QR code
WhatsApp number:+8615367865107
(Click on WhatsApp to copy and add friends)