

— Blogs —
—Products—
 Consumer hotline +8618073152920
WhatsApp:+8615367865107
Address:Room 102, District D, Houhu Industrial Park, Yuelu District, Changsha City, Hunan Province, China
Product knowledge
Time:2026-06-06 09:36:45 Popularity:419
Quick answer: TSS vs turbidity is a distinction between particle mass concentration and an optical measurement. TSS is normally reported in mg/L; turbidity is reported in method-dependent turbidity units such as NTU. An optical suspended-solids probe estimates concentration from its response to particles. Neither a shared sensor shape nor a PLC scaling change establishes a universal conversion between the two quantities.
Turbidity describes an optical response associated with light scattering, while suspended-solids concentration describes particle mass per volume. Particle size, colour, shape and composition affect the relationship. There is no universal conversion from NTU to mg/L that can be applied to every river, filter outlet or wastewater stream.
Where an optical sensor reports suspended solids, establish or verify its correlation against the site's reference method over the relevant concentration range. Changes in the particles or process can change that relationship. Keep the original turbidity and solids units distinct in the logger and reports.
SS is a general abbreviation for suspended solids. When a contract specifies TSS, identify the reference analytical method and reporting basis. The mass retained by a defined filtration-and-drying procedure is not the same thing as light scattered toward a detector. Even two optical instruments can respond differently if their wavelength, viewing geometry or processing differs.
The USGS turbidity measurement guidance distinguishes instrument methods and reporting units. Keep those details with the record when comparing instruments. An NTU label does not make unlike optical methods interchangeable, and replacing NTU with mg/L in a database does not convert turbidity into a reference-method TSS result.
| Comparison | Turbidity | Suspended-solids concentration |
|---|---|---|
| Required quantity | Optical response under a defined method | Particle mass per volume under the specified reference method |
| Common reported unit | NTU or another method-specific turbidity unit | mg/L; higher solids may use g/L |
| Online instrument | Scattering measurement calibrated with suitable standards | Optical estimate tied to a validated particle population and reference samples |
| Useful decision | Detect an optical change or monitor filtration behavior | Assess solids concentration or support a solids mass balance |
| Important limitation | Does not independently identify particle mass or composition | A previous optical correlation can fail when particles change |
A fine mineral suspension, biological flocs and dark process particles can have different scattering responses at the same mass concentration. Particle size, shape, refractive properties and color affect the signal. Bubbles and deposits introduce additional optical effects. A conversion developed at a clarifier cannot simply be applied to a river or a different production stream.
Even at one site, a change in raw material, coagulant, flow or sludge condition can alter the relationship. A concentration estimate that tracked normal operation may be biased during an upset. This matters when a control action or discharge decision occurs close to a threshold: apparent precision on the display is not evidence that the relationship remains valid.
For an illustrative arithmetic comparison only, 40 NTU would correspond to 32 mg/L with an assumed factor of 0.8, but 60 mg/L with a factor of 1.5. Neither factor is a recommendation. The example shows why a generic multiplier can change an operational conclusion without any change in the water measurement.
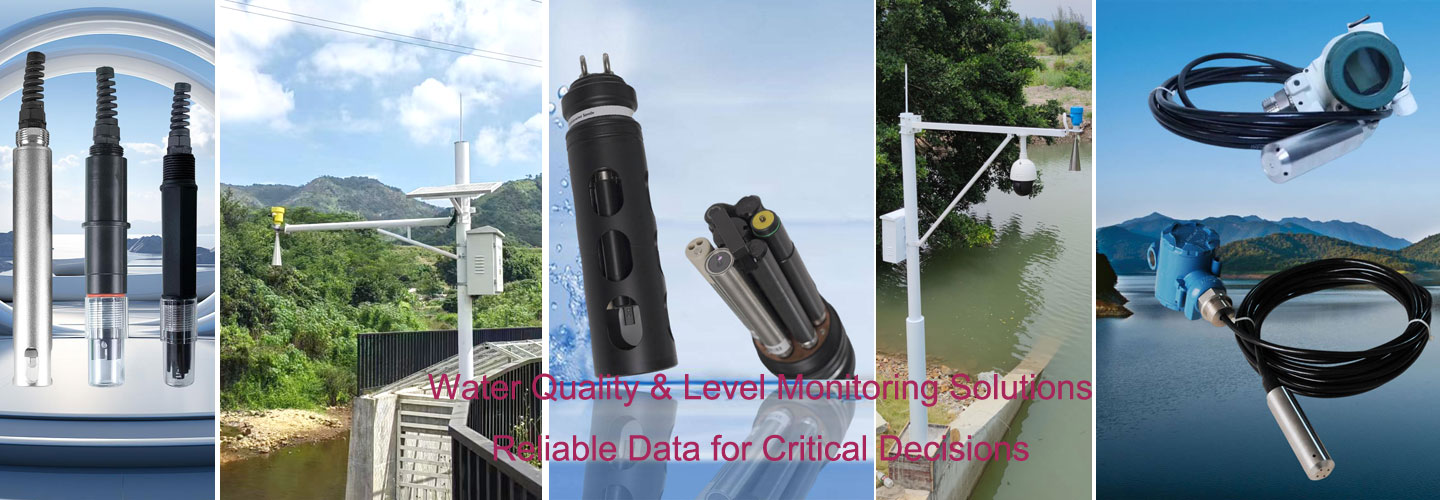
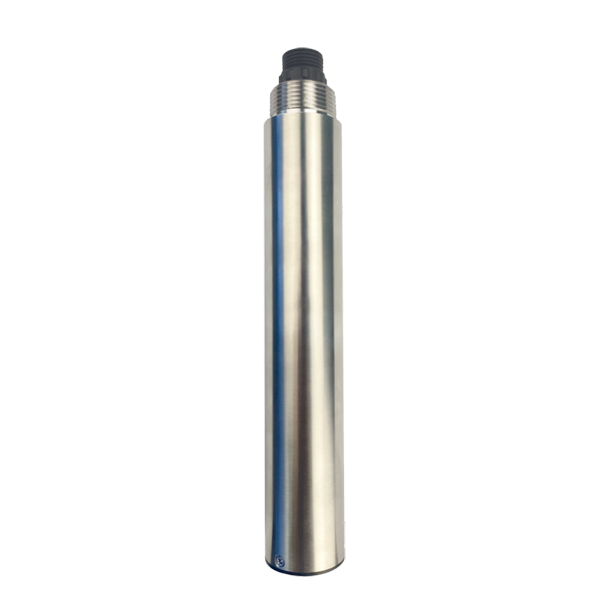
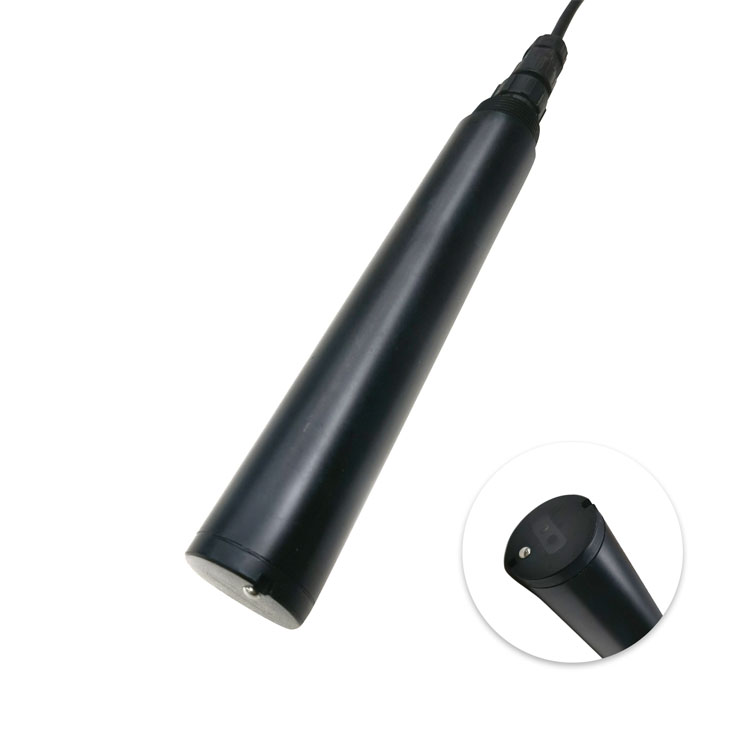
The NBL-WQ-TSS-4S is a stainless steel immersion suspended-solids probe. The NBL-WQ-TS is a turbidity instrument. The example specifications below describe particular configurations; optional ranges and outputs must be identified on the order. A polymer probe and a steel probe are not interchangeable merely because both use scattered light.
| Parameter | NBL-WQ-TSS-4S | NBL-WQ-TS |
|---|---|---|
| Measurement | Scattered-light suspended-solids estimate | 90-degree scattered-light turbidity |
| Range and resolution | 0-2000 mg/L; 0.1 mg/L | 0-20.00 NTU, 0.01 NTU; 0-100.0 or 0-1000.0 NTU, 0.1 NTU |
| Accuracy | +/-5%, dependent on sludge homogeneity; temperature +/-0.3 C | 0-20 NTU: +/-3% or +/-1.5 NTU; 0-100 NTU: +/-3% or +/-2 NTU; 0-1000 NTU: +/-5% or +/-3 NTU; temperature +/-0.3 C |
| Supply and consumption | 12-24 VDC; 0.2 W at 12 V | 12-24 VDC +/-10%; less than 0.3 W at 12 V |
| Output | RS485 Modbus RTU; optional 4-20 mA | RS485 Modbus RTU for this configuration |
| Working conditions | 0-50 C; pressure below 0.2 MPa | 0-50 C; pressure below 0.2 MPa |
| Housing and protection | 316L stainless steel; IP68 | POM/ABS; IP68 |
| Installation and cable | Immersion, 3/4 NPT; standard 5 m cable | Immersion, 3/4 NPT; standard 5 m cable |
| Cable jacket and verification | Confirm jacket compatibility for the actual exposure; two-point calibration | Confirm jacket compatibility for the actual exposure; two-point calibration |
Do not read 0.01 NTU resolution as 0.01 NTU accuracy. The low-range model's stated absolute accuracy term is much larger than that display increment. For a low-turbidity acceptance limit, request demonstrated uncertainty and the required measurement method near the limit before choosing this version. Similarly, the TSS accuracy statement does not justify an error guarantee for every heterogeneous sludge.
Start with synchronized observations from the installed probe and the reference sampling point. Document the time, location, process state and delay to the laboratory result. A sample collected after solids settle in a side line may not represent what the probe saw. Mix and handle samples according to the chosen method without altering the particles merely to obtain a closer result.
Cover the operating range and the different conditions that matter: ordinary operation, high solids, startup or a known change in particle type. Agree the number and distribution of samples with the project owner or laboratory rather than claiming one universal minimum. Keep separate samples for checking the relationship instead of using every result to fit it.
Review concentration error and bias near the decision point, not correlation alone. If reference results near the alarm limit are consistently higher than the optical estimate, a high correlation across the full range does not solve that bias. Record the accepted coefficients and the conditions in which they apply. A change in process chemistry should trigger a review before continued reliance on the same equation.
A standard-solution check and a site correlation answer different questions. The first tests the optical instrument against a defined reference response. The second tests whether that response represents particle mass in the actual water. Passing one does not automatically establish the other.
For these example probes, maintain more than 5 cm clearance from the side wall and more than 10 cm from the bottom. Keep the sensing region submerged in representative moving water without resting it in settled material. A small vessel, reflective wall or exposed window can alter the optical environment. These clearances do not by themselves qualify every process mounting.
In aerated water, position the probe to reduce persistent bubble contact while retaining representative solids. For a side-stream arrangement, inspect settling, residence time and bubble removal; a very clean-looking sample after a long line may indicate sample loss rather than improved treatment. Provide a retrievable mounting so the optical window can be inspected without pulling on the cable.
If readings change after cleaning, first record the before-and-after response and inspect deposits. If readings change when mixing stops, investigate particle settling and sample uniformity. If only the PLC value changes, compare its raw register values and scaling with the local instrument. Recalibration is not the first remedy for every jump.
Filtration turbidity monitoring: For a filter breakthrough alarm, define the turbidity method, baseline and relevant low-end performance. A 2000 mg/L suspended-solids range is not a substitute for a suitable low-turbidity instrument. Verify that bubbles or optical fouling do not create nuisance alarms.
Wastewater solids monitoring: For a solids mass balance, use a validated concentration signal and a corresponding flow measurement. For illustration, 100 mg/L at 10 m3/h equals 1 kg/h of suspended material. That calculation needs concentration, not an unvalidated NTU value; it also assumes representative, time-aligned measurements.
Industrial reuse and surface water: Variable mineral, biological or colored particles may justify both turbidity trends and reference solids testing. Use the optical channel to detect change, then investigate its cause. Neither clear-looking water nor a low solids value excludes dissolved salts, oil or other contaminants.
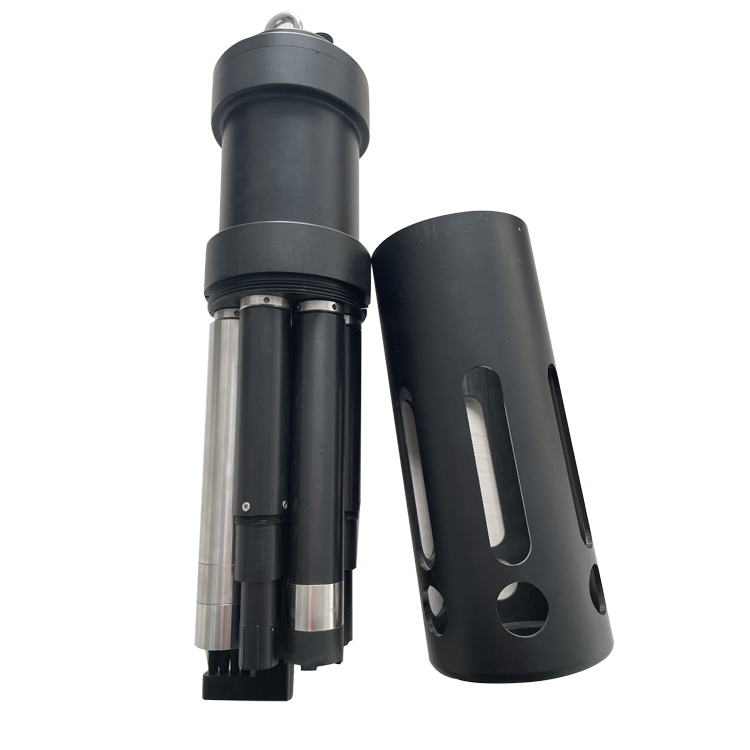
At the RTU or data logger, keep measurement identity and units with each channel. Check device address, response type, decimal scaling and stale-data behavior before releasing alarms to a PLC. A multi-parameter assembly can consolidate installation, but the shared housing does not make its channels measure the same quantity.
Only through a justified relationship for the specific sample and instrument. A generic multiplier is not reliable across different particle populations or water types. Use reference samples covering the intended range when a mass-concentration result is required.
Turbidity may suit an optical change alarm, while a solids mass balance needs concentration data. Define the operating decision and required reference method before selecting the sensor and alarm limit.
Turbidity and suspended-solids instruments address particle-related behaviour. Dissolved ions or chemicals may require conductivity or parameter-specific analysis. Low turbidity alone does not characterise every aspect of water quality.
Review particle composition, size, colour and the sensor's reference correlation. Compare representative samples over the new operating range before continuing to use an old optical-to-mass relationship.
Keep the sensor channel, range and units distinct. A numerical Modbus value labelled mg/L instead of NTU is not a valid conversion. Verify scaling against the ordered instrument and store the unit with the data.
Send the water source, normal and peak values, expected particles, installation, cleaning conditions and required output. State whether the acceptance variable is turbidity, suspended-solids concentration or both.
No. Compare normal and peak concentrations with the selected range, then assess particle homogeneity and optical behavior. Concentrated sludge may require a different range or measuring arrangement. A steel housing does not increase the concentration range.
They may use different optical methods, units or correlations, or observe different samples. Compare method, location, timing and range first. Agreement after an arbitrary offset does not establish equivalence to the required reference method.
The practical TSS vs turbidity decision is whether the project needs an optical response, a validated particle-mass estimate or both. Preserve the units and measurement method through the entire acquisition chain. NiuBoL can review the range, mounting and reference-testing requirements before an instrument is selected; a universal NTU-to-mg/L multiplier should not be part of that specification.
Prev:Multi-Parameter Water Quality Analyzer Principles: Reading Each Channel
Next:Dissolved Oxygen in Aquaculture Management: From Alarm to Recovery
Related recommendations
Sensors & Weather Stations Catalog
 Agriculture Sensors and Weather Stations Catalog-NiuBoL.pdf
Weather Stations Catalog-NiuBoL.pdf
Agriculture Sensors Catalog-NiuBoL.pdf
Water Quality Sensor Catalog-NiuBoL.pdf
Related products
 Combined air temperature and relative humidity sensor
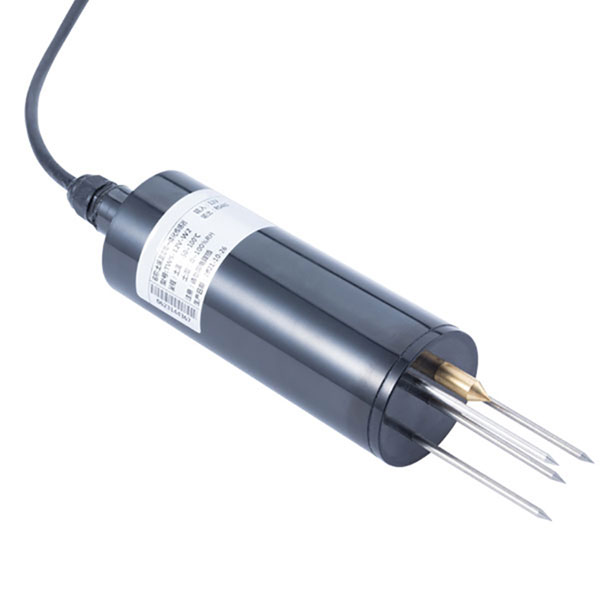 TDR Soil Moisture & Temperature Sensor for irrigation| RS485 |4-20mA| NBL-S-THR
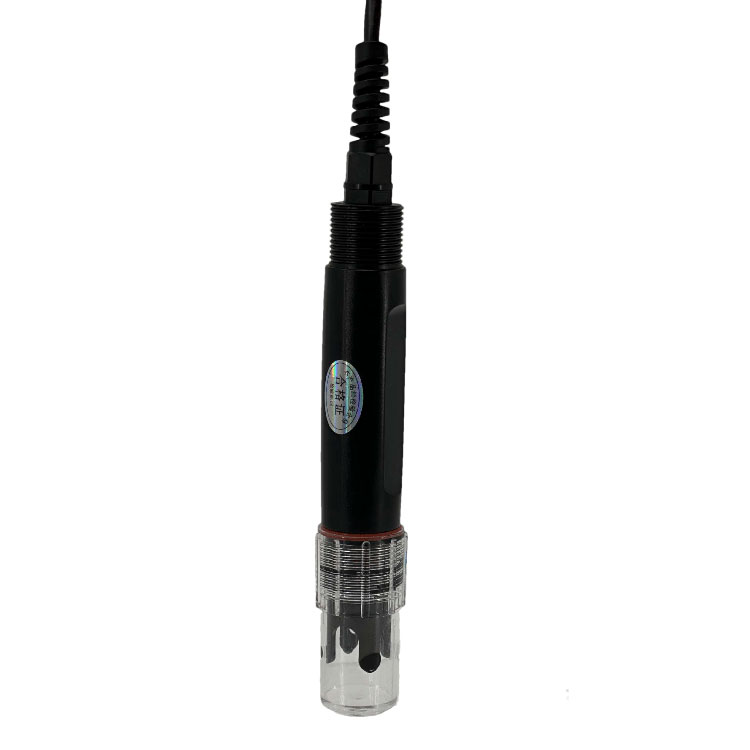 Soil pH sensor RS485 soil Testing instrument soil ph meter for agriculture |NBL-S-PH
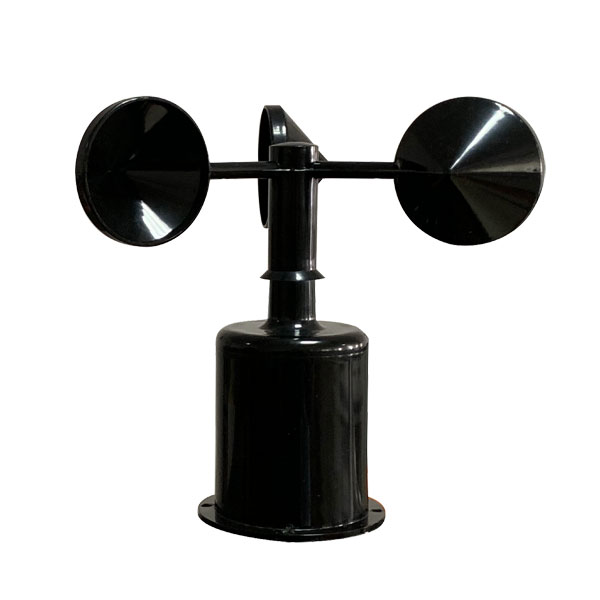 Wind Speed sensor Output Modbus/RS485/Analog/0-5V/4-20mA
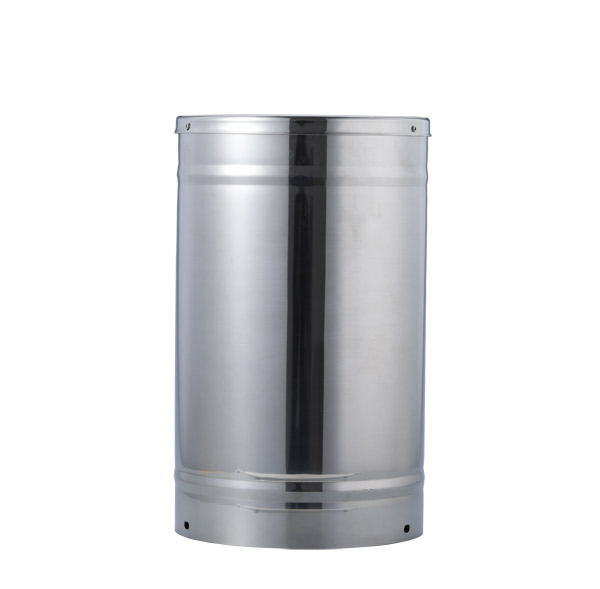 Tipping bucket rain gauge for weather monitoring auto rainfall sensor RS485/Outdoor/stainless steel
 Pyranometer Solar Radiation Sensor 4-20mA/RS485


Screenshot, WhatsApp to identify the QR code
WhatsApp number:+8615367865107
(Click on WhatsApp to copy and add friends)