

— Blogs —
—Products—
 Consumer hotline +8618073152920
WhatsApp:+8615367865107
Address:Room 102, District D, Houhu Industrial Park, Yuelu District, Changsha City, Hunan Province, China
Product knowledge
Time:2026-06-03 14:10:45 Popularity:380
Quick Answer: Turbidity measurement interference is often caused by bubbles, deposits, nearby surfaces or a sample that changes before it reaches the probe. Before changing calibration, compare the same water under controlled placement and flow conditions. A stable Modbus connection cannot distinguish real suspended particles from an optical disturbance at the measuring window.
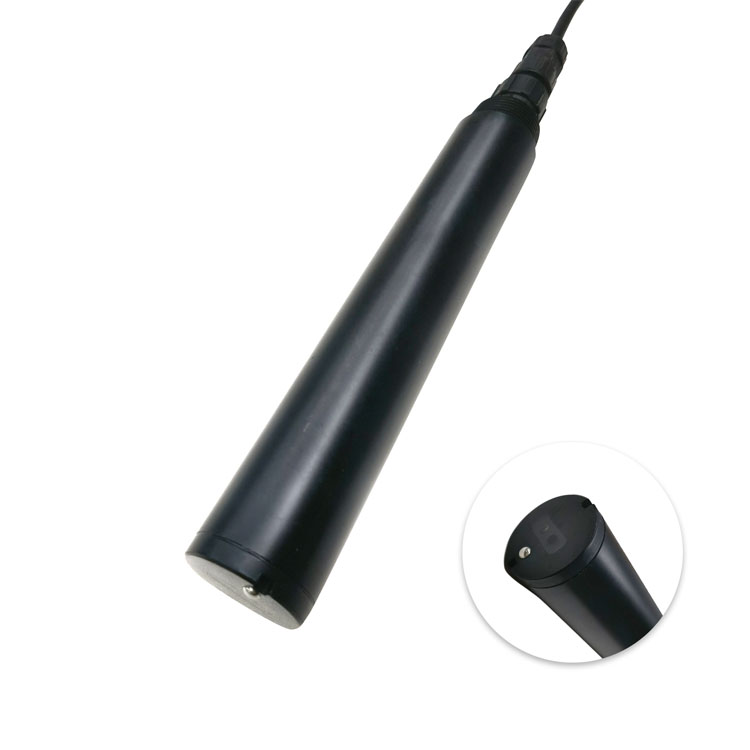
An online turbidity sensor measures scattered light, not a direct mass of suspended solids. Particle size, shape and optical properties influence the result. A change in these properties can produce a different NTU reading without a proportional change in solids concentration. That is a measurement limitation to assess, not necessarily an instrument fault.
Bubbles are different: they can enter the optical path and scatter light even when the particle load has not changed. Deposits can obscure the window. A wall or tank bottom too close to the measuring face can alter the optical environment. These effects require changes to placement, sampling or cleaning; an offset applied in the PLC can conceal the problem without correcting it.
For a detailed comparison of optical methods and sample color, see turbidity method comparability. The practical task here is to decide whether the installed measuring point delivers representative water to the probe.
| Observed pattern | Possible cause | Useful field comparison |
|---|---|---|
| Short spikes when aeration or a pump starts | Entrained air, vibration or a genuine resuspension event | Compare timing with equipment state; inspect bubbles and repeat at a nearby representative point |
| Reading changes when the probe moves near a wall | Insufficient optical clearance or different local solids distribution | Repeat at consistent depth with adequate wall and bottom clearance |
| Gradual drift that reverses after cleaning | Window fouling | Record readings before and after compatible cleaning without changing calibration |
| Bypass reading lower than the tank reading | Settling, long residence time or nonrepresentative sample takeoff | Inspect the sample line and compare fresh water from the actual measuring location |
| Frozen value or impossible steps in the PLC only | Stale communications, scaling or register interpretation | Compare the raw register, timestamp and displayed NTU before disturbing the probe |
A pump-start spike can be real if settled material is lifted into suspension. Do not automatically delete it as noise. Conversely, averaging every spike over a long interval may hide a filter breakthrough. Keep the unfiltered trend available while deciding which process states warrant an alarm.
The NiuBoL NBL-WQ-TS uses a 90-degree scattered-light method. For this probe, maintain more than 5 cm clearance from the side wall and at least 10 cm from the bottom. These are installation clearances, not a guarantee that every position in a tank represents its outlet water.
Avoid placing the optical face directly in an aeration plume or against a turbulent inlet jet. Choose a point with water exchange and safe service access. If moving away from bubbles also moves the probe into a stagnant corner, the new installation trades one error for another. Compare trends at candidate positions during actual operating transitions, including mixing and pumping.
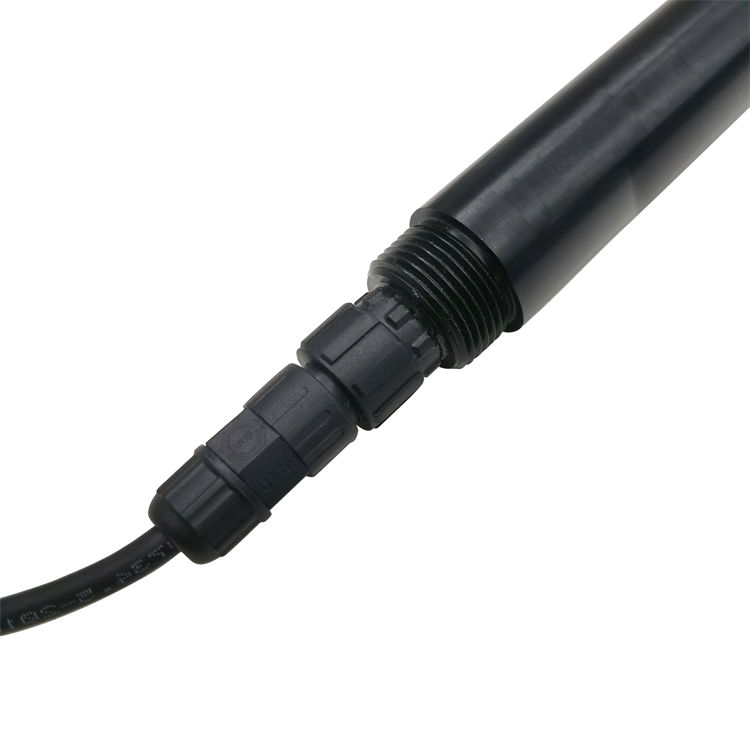
The threaded section shown below supports mechanical mounting. Support the probe and cable independently; do not suspend it by cable tension. Check clearance again after the bracket is loaded, since a flexible mount may shift toward a wall during operation.
A bypass can make maintenance easier, but it changes the measurement system. Bubbles may form after a pressure drop, solids may settle in low spots, and a long line may delay the event being monitored. An installation that looks calm at the outlet can still deliver a biased sample.
Before specifying a flow cell, establish the sample takeoff location, pressure at the probe, discharge route and expected residence time. For a liquid-filled line, the approximate transport delay is internal liquid volume divided by flow rate. This estimate excludes mixing, settling and the sensor response, but helps explain why a remote cell may detect a process change later than an immersed probe.
Do not put an immersion probe directly into an arbitrary pressurized fitting. The holder, seals, cleaning access and actual pressure must suit the probe. If low-level filtered water is the duty, compare a purpose-designed low-range installation rather than assuming any immersion probe will meet the acceptance threshold.
| Parameter | Specification or selection condition |
|---|---|
| Selectable ranges | 0-20.00, 0-100.0 or 0-1000.0 NTU |
| Resolution | 0.01 NTU for the 20 NTU range; 0.1 NTU for the other two ranges |
| Accuracy expressions | 20 NTU range: +/-3% or +/-1.5 NTU; 100 NTU: +/-3% or +/-2 NTU; 1000 NTU: +/-5% or +/-3 NTU. Confirm percentage basis and applicable rule for acceptance. |
| Water conditions | 0-50 degrees C; below 0.2 MPa |
| Supply / consumption | 12-24 V DC; 0.2 W at 12 V |
| Communication | RS485 Modbus RTU; confirm the ordered 4-20 mA arrangement if required |
| Housing / protection | POM and ABS; IP68 |
| Mounting / cable | Immersion, 3/4 NPT; standard 5 m cable. Confirm jacket compatibility for the water and cleaning chemicals. |
These limits belong to the NBL-WQ-TS turbidity probe. A 0.01 NTU display increment is not a 0.01 NTU accuracy guarantee. If the allowed error near the process threshold is tighter than the quoted specification, resolve that mismatch before evaluating alarm performance.
For PLC or RTU records, save NTU with its acquisition time and communication validity. A timeout should not silently become zero turbidity. Once a stable location is established, set cleaning frequency from observed fouling rather than promising an unattended interval for all waters.
Yes. Bubbles can scatter light in the measuring region. Correlate excursions with aeration and pump operation, then compare at a representative bubble-reduced position. Do not assume every excursion is air; pumping can also resuspend real solids.
No. Determine whether those spikes represent an important process event before selecting averaging or persistence. Retain raw data so the effect of the filter can be reviewed.
No. A poorly designed sample line can introduce settling, gas release and delay. It helps only when the sample remains representative and the cell pressure and installation suit the probe.
The basic NBL-WQ-TS product configuration lists 100 NTU as its middle range. Confirm the complete model and range on the quotation; a different sensor version may have different limits.
Provide the model, range, trend around the event, operating states, installation photographs, wall and bottom clearances, cleaning results and a standard check. Include the raw Modbus value if the PLC display differs.
Control turbidity measurement interference by keeping the optical region clean and the sample representative. First separate bubbles, placement and transport effects from real changes in solids; then assess calibration. For a NiuBoL sensor inquiry, send the normal NTU band, event peak, allowable error and installation arrangement so the range and mounting can be reviewed together.
Prev:Online Turbidity Sensor Selection: Range, Error Limits and PLC Mapping
Next:ORP Meter Applications: Match Redox Trends to Treatment Decisions
Related recommendations
Sensors & Weather Stations Catalog
 Agriculture Sensors and Weather Stations Catalog-NiuBoL.pdf
Weather Stations Catalog-NiuBoL.pdf
Agriculture Sensors Catalog-NiuBoL.pdf
Water Quality Sensor Catalog-NiuBoL.pdf
Related products
 Combined air temperature and relative humidity sensor
 TDR Soil Moisture & Temperature Sensor for irrigation| RS485 |4-20mA| NBL-S-THR
 Soil pH sensor RS485 soil Testing instrument soil ph meter for agriculture |NBL-S-PH
 Wind Speed sensor Output Modbus/RS485/Analog/0-5V/4-20mA
 Tipping bucket rain gauge for weather monitoring auto rainfall sensor RS485/Outdoor/stainless steel
 Pyranometer Solar Radiation Sensor 4-20mA/RS485

Screenshot, WhatsApp to identify the QR code
WhatsApp number:+8615367865107
(Click on WhatsApp to copy and add friends)