

— Blogs —
—Products—
 Consumer hotline +8618073152920
WhatsApp:+8615367865107
Address:Room 102, District D, Houhu Industrial Park, Yuelu District, Changsha City, Hunan Province, China
Product knowledge
Time:2026-09-16 17:00:00 Popularity:247
Quick Answer: Diagnose wastewater online monitoring system problems by separating missing data, incorrect data and unrepresentative water. First preserve the fault reading and its timestamp. Then compare the instrument, PLC and platform, inspect the measuring point, and test one suspected cause at a time. Recalibration should follow a valid comparison, not be the first response to every disagreement.

A suspended-solids value that rises during a change in plant flow may be real. A value that jumps whenever the cabinet restarts may have an electrical or decoding cause. Both can trigger the same high alarm, but replacing the probe will not resolve both. Ask when the fault started, which channels changed together, and whether the plant, sample circuit or software changed at that time.
Keep the original reading, device status, acquisition time and operator observation. Mark affected values as suspect according to the plant procedure rather than silently deleting them. Where a measurement influences dosing or aeration, the authorized operator should place the affected function in its approved alternative mode before investigation. Do not disconnect a live control input merely to see what happens.
| Observed pattern | First comparison | Useful next check |
|---|---|---|
| All channels disappear together | Local instrument access versus PLC and platform | Shared supply, bus, gateway or network outage |
| One parameter drifts while others remain credible | Same-point reference result and sensor inspection | Fouling, consumable condition, interference or calibration |
| Host value differs by a constant factor | Raw response and decoded engineering value | Scaling, units, data type or channel mapping |
| Several values stop changing | Last successful device read and displayed acquisition time | Cached values, failed polling or a stagnant sample |
| Spikes follow a pump or cleaning cycle | Event times and physical observations | Bubbles, sample interruption, power disturbance or cleaning state |
These patterns identify a test sequence, not a diagnosis by themselves. If a local display is absent, an authorized technician can use a compatible reader with the plant input safely isolated. Avoid putting a second Modbus master on an operating RS485 segment.
The NiuBoL NBL-WQ-MPS-5A combines selected measurements in one self-cleaning assembly. This reduces separate underwater installations where the measurements belong together, but also means that a shared supply or communications fault can affect several reported channels. Check the assembly before ordering several replacement sensing modules.
| MPS-5A requirement | Model specification | Diagnostic use |
|---|---|---|
| Supply | 12 V DC +/-5% | Check voltage at the instrument connection under the relevant load, not only at the cabinet supply |
| Power | 5 W at 12 V | Inspect supply capacity and cable loss; this figure does not specify transient current |
| Interface | RS485, Modbus RTU | Compare a valid response with the receiving-system tag |
| Default serial format | 9600 bit/s, 8 data bits, no parity, 1 stop bit | Use the installed configuration if it has been changed |
| Cable | 5 m standard; four-core twisted-pair shielded cable | Inspect wet joints, damaged insulation and extension arrangements |
| Channel capacity | Up to eight parameters including temperature | Check the fitted modules; an unused channel is not a valid zero measurement |
| Cleaning | Automatic brush with configurable interval and cycle count | Compare disturbances with the cleaning schedule and brush condition |
A nominal 12 V supply reading without the instrument connected does not exclude voltage drop. Use safe access and appropriate test equipment to check the loaded circuit. Do not apply a plant's 24 V supply directly to this 12 V assembly because another probe in the cabinet accepts 24 V.
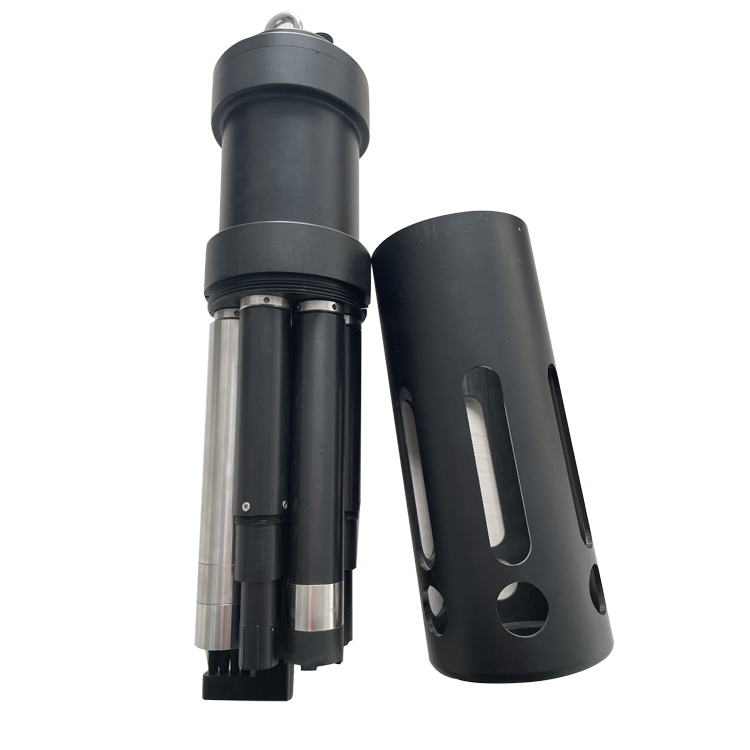
If the device value changes correctly but the platform does not, investigate mapping, transmission and caching before disturbing the sensor. If no response arrives, check the supply, configured serial settings, A/B assignment and bus topology. Follow the actual device wiring definition; conductor colors on a replacement cable are not a reliable substitute.
For a digital instrument, RS485 describes the electrical connection, while Modbus RTU defines message exchange. Neither guarantees that two products use the same register layout. A driver written for a different model can return plausible but incorrect values. Keep the tested driver version with the device configuration.
Where faults coincide with large motor starts, compare cabinet events and supply observations before blaming the optical measurement. Have a qualified technician inspect segregation, shielding and grounding against the installed design. Do not remove protective earth or improvise a ground connection as a diagnostic shortcut. If a short, correctly powered service connection works while the installed route fails, investigate that route without assuming the instrument is defective.
Collect the comparison sample beside the installed point and record the time. A grab sample from an upstream pipe or a tank surface may not represent the liquid passing the probe. Account for mixing, settling and sample transport before interpreting the difference. For a pumped station, inspect the actual flow and cell condition rather than relying on the pump's run indication.
Sample transport creates delay. As a simple illustration, 3 L of effective line volume at 0.5 L/min gives a nominal six-minute transport time before cell mixing and instrument response are considered. A laboratory sample taken at the intake should not be compared with an unshifted online timestamp during a short pollution peak.
A blocked intake can leave a sensor reporting credible values from old water. Observe delivery and drainage, check for trapped gas, and confirm that the cell exchanges water rather than bypassing it. A pump running with no effective sample flow is a sampling failure even if every sensor and network connection remains online.
Check whether the methods measure the same quantity. An optical COD estimate and a digestion-based COD result can respond differently to a changed wastewater composition. Suspended-solids mass concentration is not interchangeable with turbidity in NTU. Investigate method and particle changes before forcing a calibration curve to match one result.
Salinity also requires a method-specific assessment. Chloride can interfere with some chemical COD procedures, but that does not establish the same interference mechanism for every optical probe. Identify the actual method, chloride conditions and reference procedure before recommending a pretreatment or replacement instrument.
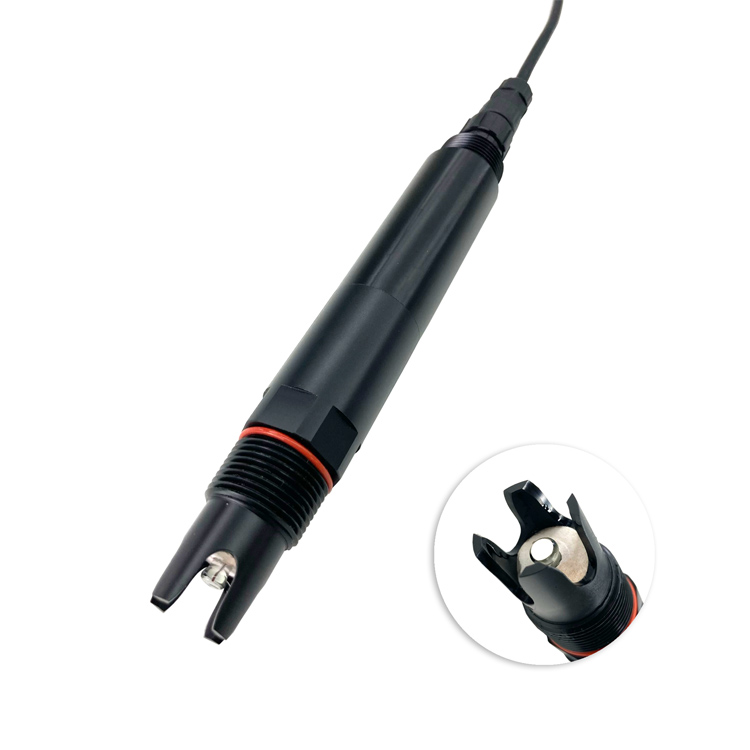
For a drifting pH channel, record the as-found value before cleaning. Inspect the bulb and reference junction without abrasive treatment. After cleaning by the specified procedure, allow the probe to stabilize and repeat the comparison. A change after cleaning supports a fouling diagnosis; it does not by itself prove the calibration is correct.
Check suitable, uncontaminated reference solutions at the relevant temperature before adjustment. If a probe passes the controlled check but disagrees only in process water, examine placement, mixing and matrix effects. If it fails in reference solutions after proper cleaning, investigate calibration, electrode condition and replacement parts.
Use the same logic for dissolved oxygen, but use the optical sensor's own inspection and calibration procedure. An apparent DO increase near an aerator may reflect bubbles or a different local zone. Moving the probe changes the measurement location, so note the change instead of joining the two trends as if they were identical observations.
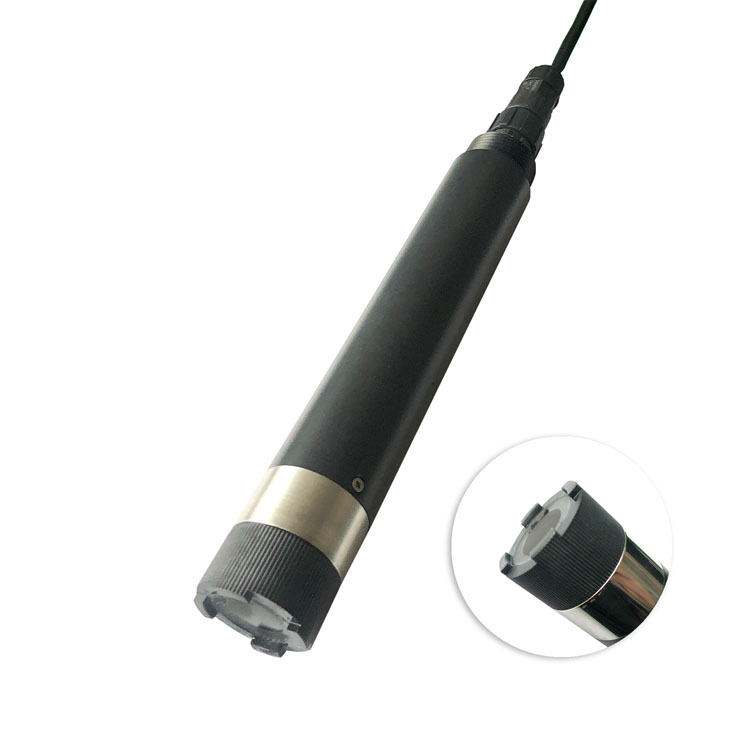
After a repair, restore the original operating conditions and confirm fresh values throughout the data path. Observe the event that previously triggered the fault, such as a pump start or brush cycle, if it can be repeated safely. A steady reading during an idle bench test may not reproduce the site failure.
Record what changed: a connector, supply, driver, calibration factor or mounting point. Changing all five together makes recurrence harder to diagnose. Keep a short fault history with the before-and-after values and the specific test that supported the repair. For routine service scheduling, the separate water quality meter maintenance guide covers cleaning and reference-check planning.
When requesting NiuBoL support, send the model and serial number, affected parameter, event times, raw response if available, installed settings, measuring-point photographs and the comparison method. For turbidity or solids faults, include a description of bubbles, sludge, color and recent process changes. This allows a technical assessment before proposing a new sensor.
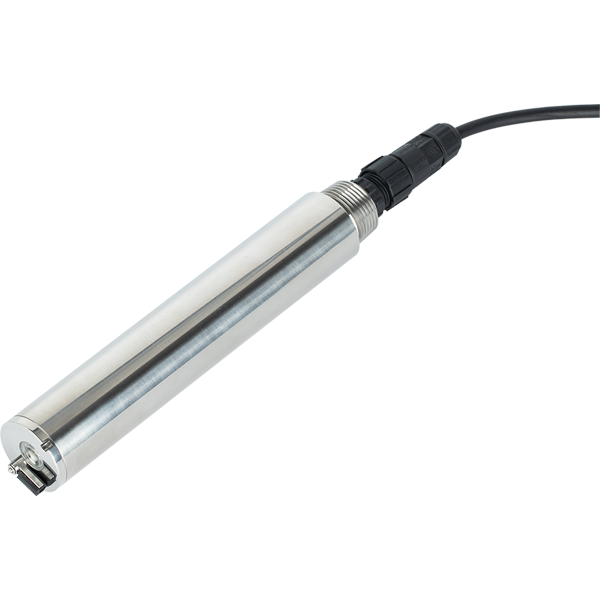
No. A zero may be a valid result, an unused channel, an incorrectly decoded value or a substituted fault value. Confirm that the channel is fitted, the device is responding and the reported status allows the value to be used.
Inspect and clean it first, preserve the as-found result, and perform a suitable reference check. Recalibrating a dirty sensor can conceal fouling temporarily and create a new bias after the next cleaning.
A valid response can still be decoded incorrectly. Check the register, parameter identity, signedness, data type, scale and engineering unit against the installed device version. Then compare the decoded value with the PLC tag.
Yes, but calculate its effective volume and verify flow before assigning a delay. Transport, cell turnover, instrument response and alarm persistence all contribute. The alarm must also distinguish a true low concentration from failed sample delivery.
Replacement is reasonable when damage, exhausted consumables or repeated failure under valid reference conditions is demonstrated, or when the measuring principle is unsuitable for the water. A difference between unmatched samples is not sufficient evidence.
Identify whether the failed item is the sensing element, complete probe, cable, reader or shared assembly. State the model, configuration and test results. This avoids buying a complete station to resolve a repairable connection fault.
Effective fault finding separates the water, instrument and receiving system. Preserve the original symptom, compare like-for-like samples and values, then change one cause at a time. Purchase replacement equipment only after the evidence identifies an unsuitable or failed component.
Prev:Oil in Water Monitoring Wastewater Guide: Why It Matters and How to Specify It
Next:Wastewater Online Monitoring Control System: From Data to Action
Related recommendations
Sensors & Weather Stations Catalog
 Agriculture Sensors and Weather Stations Catalog-NiuBoL.pdf
Weather Stations Catalog-NiuBoL.pdf
Agriculture Sensors Catalog-NiuBoL.pdf
Water Quality Sensor Catalog-NiuBoL.pdf
Related products
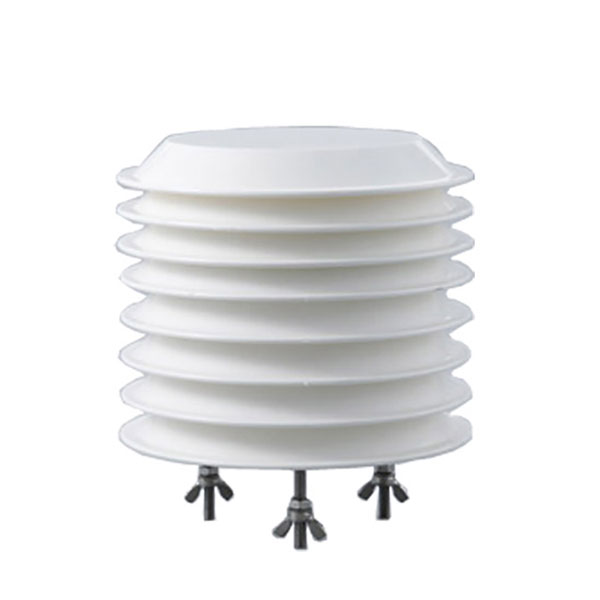 Combined air temperature and relative humidity sensor
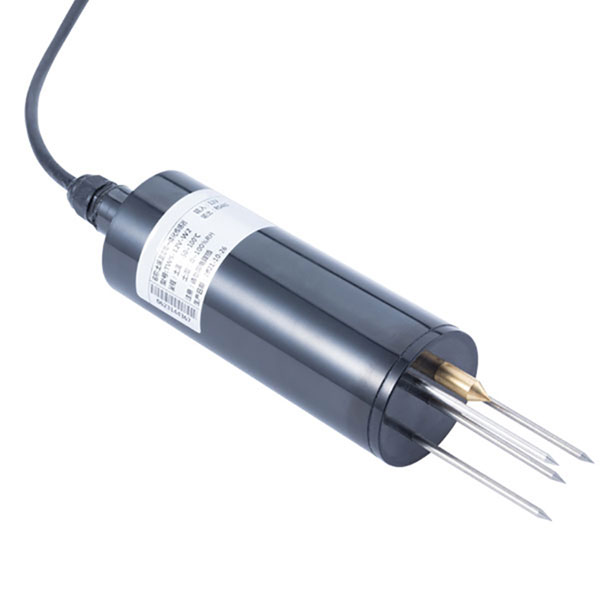 TDR Soil Moisture & Temperature Sensor for irrigation| RS485 |4-20mA| NBL-S-THR
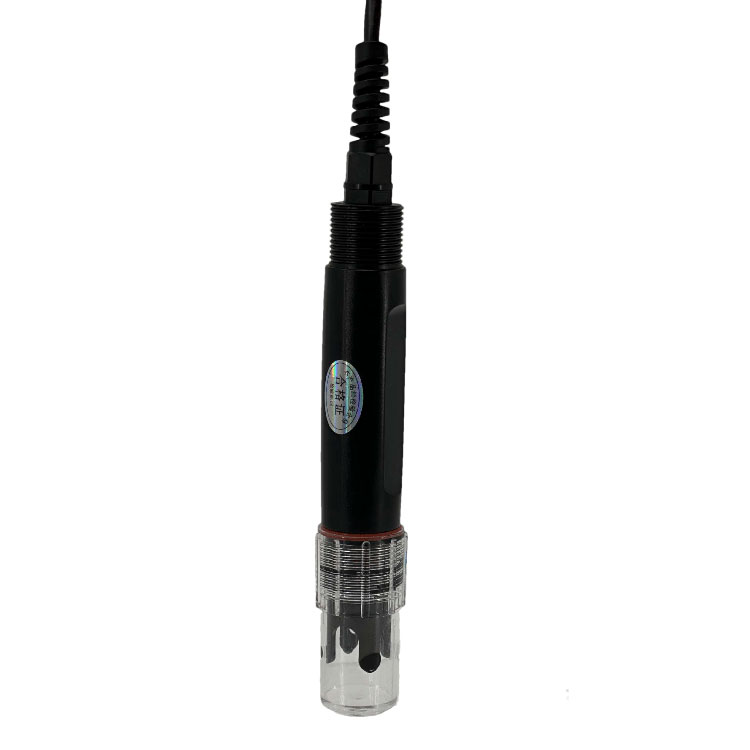 Soil pH sensor RS485 soil Testing instrument soil ph meter for agriculture |NBL-S-PH
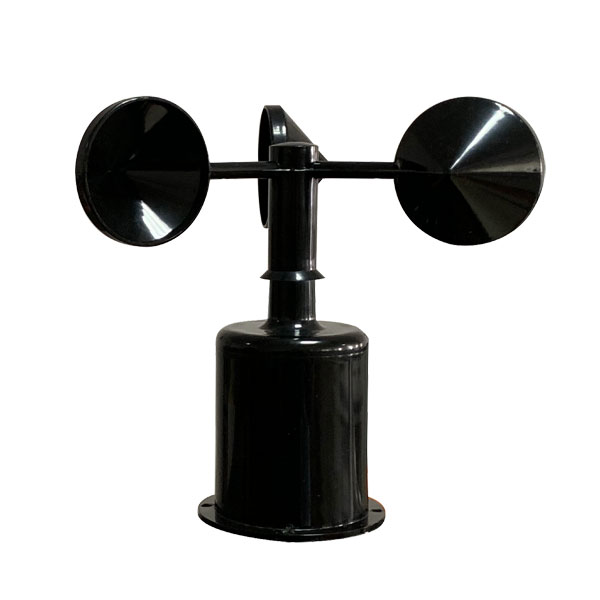 Wind Speed sensor Output Modbus/RS485/Analog/0-5V/4-20mA
 Tipping bucket rain gauge for weather monitoring auto rainfall sensor RS485/Outdoor/stainless steel
 Pyranometer Solar Radiation Sensor 4-20mA/RS485

Screenshot, WhatsApp to identify the QR code
WhatsApp number:+8615367865107
(Click on WhatsApp to copy and add friends)