


— Blogs —
—Products—
 Consumer hotline +8618073152920
 WhatsApp:+8615367865107
Address:Room 102, District D, Houhu Industrial Park, Yuelu District, Changsha City, Hunan Province, China
Product knowledge
Time:2026-06-24 11:45:13 Popularity:16
Water environment monitoring is a system-level task that connects water quality, hydrology, meteorology and platform analysis. A useful project does not only ask whether the water is clear or polluted at one moment. It needs continuous data on parameters such as pH, conductivity, dissolved oxygen, turbidity, water temperature, water level and flow so operators can identify changes and respond in time.
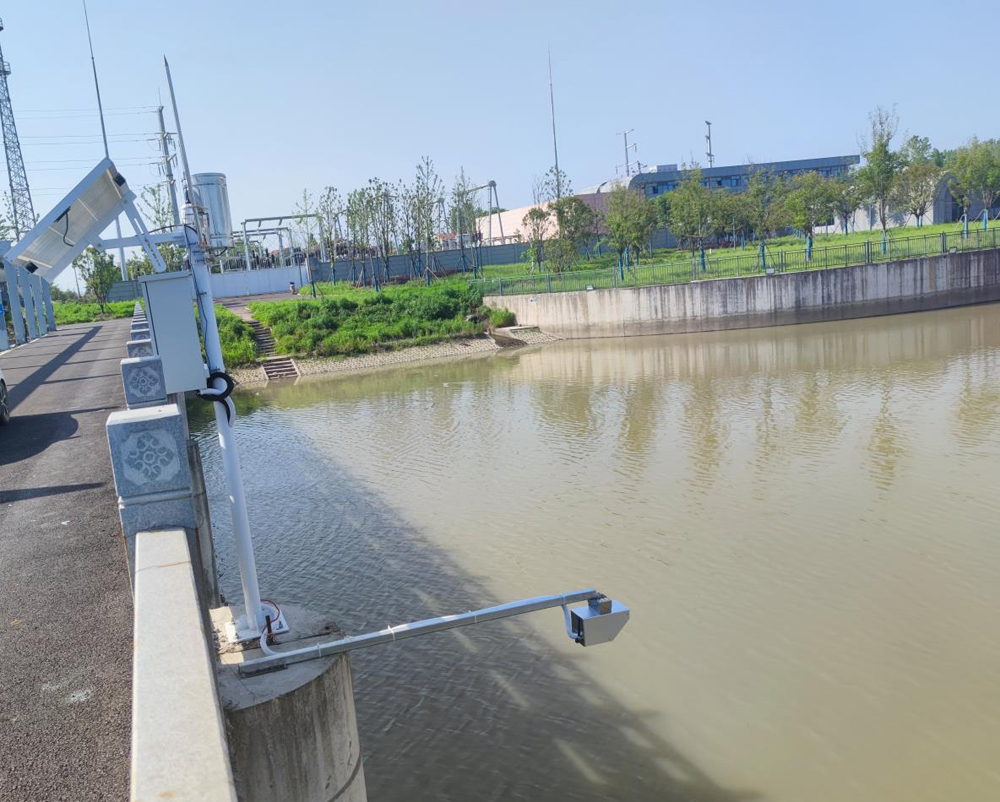
For rivers, lakes, reservoirs, aquaculture ponds, drainage channels and treatment facilities, the monitoring system should be designed as an integrated architecture. NiuBoL water environment monitoring solutions can combine online water quality sensors, water level instruments, flowmeters, data acquisition terminals and cloud platforms for project deployment.
Eutrophication, abnormal dissolved oxygen, high turbidity, conductivity changes and sudden pH variation can all affect aquatic ecology and water use. In a lake, reservoir or river section, manual sampling alone may miss short-term changes caused by rainfall, discharge, algae growth or upstream inflow. Online monitoring helps project owners understand trends and abnormal events.
A complete water environment project may include water quality, water quantity, water level and meteorological background data. System integrators need to determine which data will be used for compliance, early warning, operation control, ecological assessment or public reporting. The answer determines sensor type, installation method, communication method and platform functions.
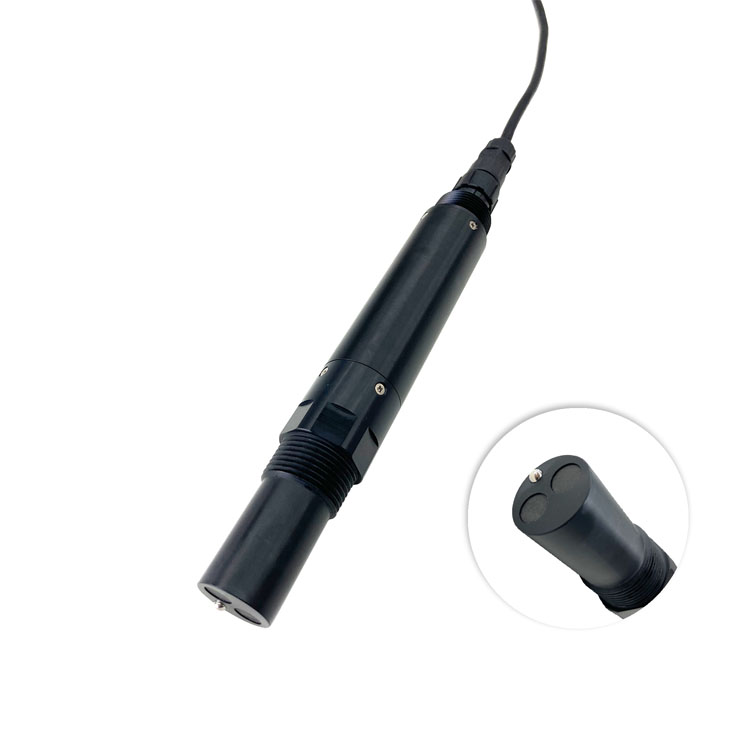
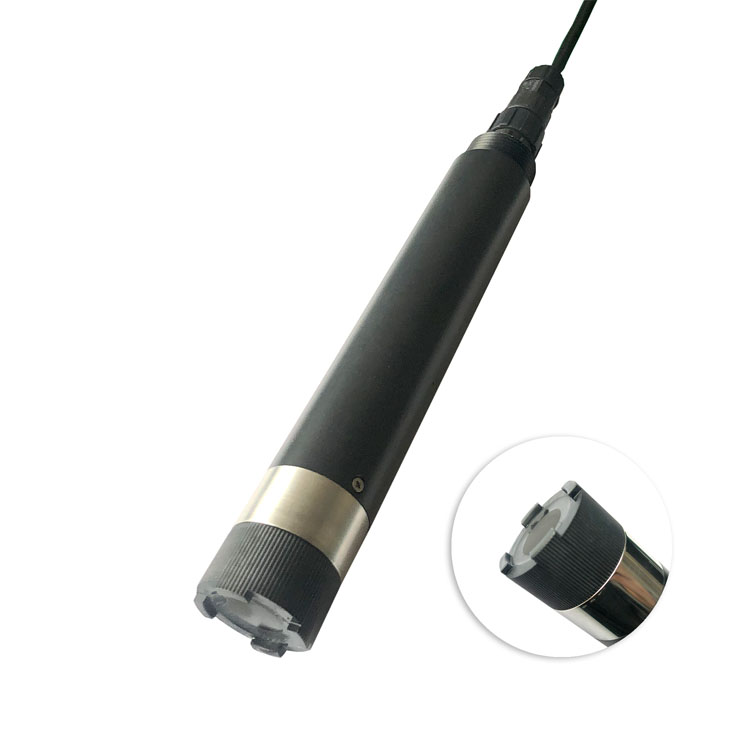
Water quality sensors are the field perception layer. Core parameters usually include water temperature, pH, electrical conductivity, dissolved oxygen and turbidity. Advanced monitoring may add ORP, ammonia nitrogen, nitrate, total phosphorus, total nitrogen, chlorophyll, blue-green algae, COD or BOD analyzers according to the project objective.
Water quantity and hydrological devices include electromagnetic flowmeters, ultrasonic flowmeters, open-channel flowmeters, radar level sensors, ultrasonic level sensors and pressure level sensors. A data acquisition terminal or RTU then collects sensor signals through RS485 Modbus, analog signals or other interfaces and sends the data to the monitoring platform.
RS485 and Modbus RTU are widely used in water quality monitoring because they allow several instruments to connect to one acquisition terminal. The integrator should confirm register maps, sensor address, baud rate, data units, temperature compensation and alarm thresholds before field installation.
For remote water sites, 4G DTU or RTU upload is common. For treatment plants or industrial control rooms, signals may also enter PLC or SCADA systems. The project should define whether the platform only displays values or also generates alarms, reports, water quality scoring and trend prediction.
| Parameter | Reference Value | Engineering Note |
|---|---|---|
| pH sensor range | 0 to 14 pH, typical resolution 0.01 pH | Used for acidity and alkalinity monitoring in surface water and process water |
| Conductivity sensor range | 0 to 5000 uS/cm for common online EC sensor configurations | Used for salinity, dissolved ion and process change reference |
| Dissolved oxygen range | 0 to 20.00 mg/L or 0 to 200% saturation for fluorescence DO sensors | Important for aquaculture, rivers and wastewater aeration |
| Turbidity range | Configured by project requirement, commonly used for suspended solids and water clarity monitoring | Range must match clean water, river water or wastewater conditions |
| Water temperature | Typical online compensation parameter, often -5 to 60℃ depending on sensor | Supports compensation and ecological interpretation |
| Water level | Radar, ultrasonic or pressure level instruments selected by site conditions | Used for hydrology, flood warning and reservoir monitoring |
| Flow measurement | Electromagnetic, ultrasonic or open-channel flowmeter depending on channel type | Used for water quantity and discharge calculation |
| Supply voltage | DC 12-24V for many online sensors and acquisition terminals | Confirm device-level power demand and solar feasibility |
| Output signal | RS485 / Modbus RTU, analog output optional on some instruments | Choose according to data logger, PLC or platform architecture |
| Protection level | IP68 for immersed water quality probes; IP65 or higher for field cabinets | Protection must match immersion and outdoor exposure |
| Working temperature | Typically -20 to 60℃ for many water quality probes; confirm each model | Select according to seasonal water and air conditions |
| Cable material | Waterproof cable, commonly PVC or corrosion-resistant jacket depending on sensor | Cable material should match immersion, UV and chemical exposure |
Site challenge: Water quality changes may occur after rainfall, discharge, algae growth or seasonal temperature shifts.
System integration scheme: Install pH, EC, DO, turbidity and water temperature sensors with RS485 acquisition and 4G upload.
User value: Managers receive continuous trend data and alarms instead of relying only on periodic sampling.
Site challenge: Water sources require early detection of abnormal parameters and hydrological changes.
System integration scheme: Combine online water quality sensors with radar level, rainfall and platform reporting.
User value: Operators can identify abnormal events and create traceable records for management.
Site challenge: Low dissolved oxygen, pH fluctuation and conductivity changes can affect aquatic animals quickly.
System integration scheme: Use DO, pH, temperature and conductivity sensors with alarm thresholds and mobile viewing.
User value: Farm operators can respond to oxygen or water exchange needs earlier.
Site challenge: Process water may change rapidly and must often be tracked with online instruments.
System integration scheme: Integrate pH, conductivity, turbidity, COD or ammonia nitrogen instruments into RTU or PLC systems.
User value: Facility managers gain continuous process reference and compliance support data.
Site challenge: Storm events change water level, turbidity and flow within a short time.
System integration scheme: Combine water level, rainfall, flow and turbidity monitoring with warning platform functions.
User value: Municipal teams can compare rainfall events with drainage response and maintenance priorities.
Water quality sensors require correct installation depth, stable flow conditions and regular maintenance. A probe installed in stagnant water, heavy sediment or direct air exposure may not represent the monitored water body. The installation structure should allow safe removal for cleaning and calibration.
The platform should show parameter units, sensor location, alarm thresholds and historical curves. For projects with multiple stations, GIS display and basin-level grouping can make the system easier to operate and easier to explain to managers.
Water environment projects often fail at the configuration stage because every possible parameter is added without a clear decision purpose. A practical standard configuration starts with pH, conductivity, dissolved oxygen, turbidity and temperature, then adds nutrient or organic pollution indicators only when the management question requires them.
Water level and flow should not be treated as separate from water quality. Rainfall, rising level and changing flow can explain why turbidity, dissolved oxygen or conductivity changes. This is why basin projects often need both water quality sensors and hydrological instruments.
Probe maintenance must be part of the purchase scope. Cleaning access, calibration schedule, cable protection and replacement parts determine whether online data remains credible after the first months of operation.
A high-value water monitoring project should include a maintenance budget from the beginning. Online data is only useful when probes remain clean, calibrated and correctly installed through seasonal water changes.
A: A basic system usually includes water temperature, pH, conductivity, dissolved oxygen and turbidity. Water level and rainfall are added when hydrological response is important.
A: They should be added when nutrient pollution, discharge control or treatment process decisions require those values. They increase cost and maintenance, so the project purpose should justify them.
A: Yes, many online water quality sensors support RS485 Modbus RTU for connection to RTUs, data loggers, PLCs or platforms.
A: Choose points with representative water mixing, safe access, stable mounting and enough depth. Avoid locations with heavy sediment, trapped debris or direct turbulence unless the project requires it.
A: Plan probe cleaning, calibration, inspection of waterproof connectors, cable protection and replacement of consumable parts according to sensor type.
A: Yes. DO, pH, temperature and conductivity alarms can be configured for aquaculture projects when sensor placement and platform thresholds are correctly set.
A: Water level and flow help explain water quality changes, flood response and discharge volume. They are valuable when water quality is affected by hydrological events.
A: It should include parameters, ranges, sensor materials, communication protocol, power supply, cabinet protection, platform functions and maintenance scope.
A: NiuBoL can provide water quality sensors, hydrological monitoring instruments, acquisition devices and platform-oriented solutions for integrated projects.
A: Use correct installation, documented calibration, regular maintenance and platform records that show sensor location, units and alarm history.
A water environment monitoring system should be designed around the decisions that the owner needs to make: warning, compliance, ecological assessment, aquaculture operation or process control. NiuBoL can support these projects with water quality sensors, water level and flow instruments, RS485 Modbus integration and platform-based monitoring architecture.
Prev:Micro Meteorological Online Monitoring Device Manufacturer Guide for Modbus Weather Systems
Next:Water-Fertilizer Integrated Smart Irrigation Control System Components and Procurement Guide
Related recommendations
Sensors & Weather Stations Catalog
 Agriculture Sensors and Weather Stations Catalog-NiuBoL.pdf
Weather Stations Catalog-NiuBoL.pdf
Agriculture Sensors Catalog-NiuBoL.pdf
Water Quality Sensor Catalog-NiuBoL.pdf
Related products
 Combined air temperature and relative humidity sensor
 Soil Moisture Temperature sensor for irrigation|NBL-S-THR
 Soil pH sensor RS485 soil Testing instrument soil ph meter for agriculture |NBL-S-PH
 Wind Speed sensor Output Modbus/RS485/Analog/0-5V/4-20mA
 Tipping bucket rain gauge for weather monitoring auto rainfall sensor RS485/Outdoor/stainless steel
 Pyranometer Solar Radiation Sensor 4-20mA/RS485

Screenshot, WhatsApp to identify the QR code
WhatsApp number:+8615367865107
(Click on WhatsApp to copy and add friends)
