

— Blogs —
—Products—
 Consumer hotline +8618073152920
WhatsApp:+8615367865107
Address:Room 102, District D, Houhu Industrial Park, Yuelu District, Changsha City, Hunan Province, China
Product knowledge
Time:2026-09-19 12:00:00 Popularity:227
Online turbidity sensor selection for drinking water starts with the monitoring point, not the largest measuring range. Raw-water, individual-filter and combined-filter measurements answer different operating questions. Select the optical method and low-range performance required at that point, then design the sample path and data channel around the decision it supports. A sensor that tracks a substantial raw-water change may be unsuitable for distinguishing small changes in filtered water, even when both instruments display NTU.
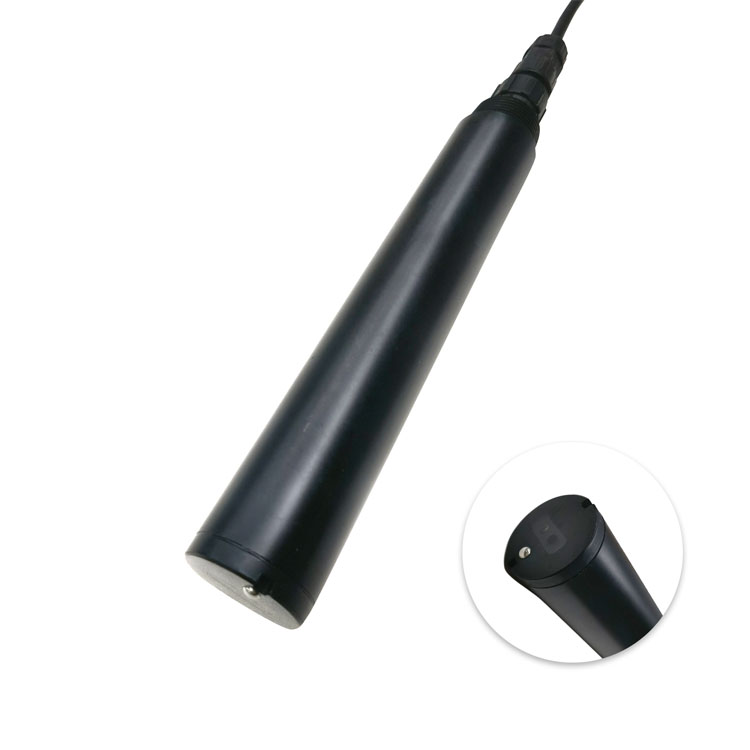
A combined filter outlet can show that the blended stream has changed, but it cannot identify the responsible filter. If operators need to compare filter runs, investigate recovery after backwashing or isolate a deteriorating unit, each relevant filter needs an identifiable measurement before its outlet joins the common manifold. Adding one instrument after the manifold does not create individual-filter visibility.
Start the instrument schedule with the question the operator will ask. A plant investigating variable source-water loading needs a different channel arrangement from a plant investigating short excursions as filters return to service. This distinction determines the number of sampling points, the routing of sample lines and the operating states that must accompany the trend.
| Monitoring point | Decision supported | Selection consequence |
|---|---|---|
| Raw-water inlet | Recognize changing particulate loading entering treatment | Allow for source-water excursions; evaluate fouling and representative sampling |
| Settled water before filtration | Compare solids removal upstream of the filters | Keep each treatment stream identifiable where separate performance matters |
| Individual filter effluent | Locate a filter-specific change and assess its return to service | Prioritize useful low-range performance, timely sampling and filter-state tags |
| Combined filter effluent | Observe the mixed filtered-water stream | Use a representative combined-stream tap; retain individual channels for diagnosis |
| Storage outlet or distribution entry | Detect changes after storage or subsequent treatment | Do not treat this downstream result as a direct substitute for filter-outlet performance |
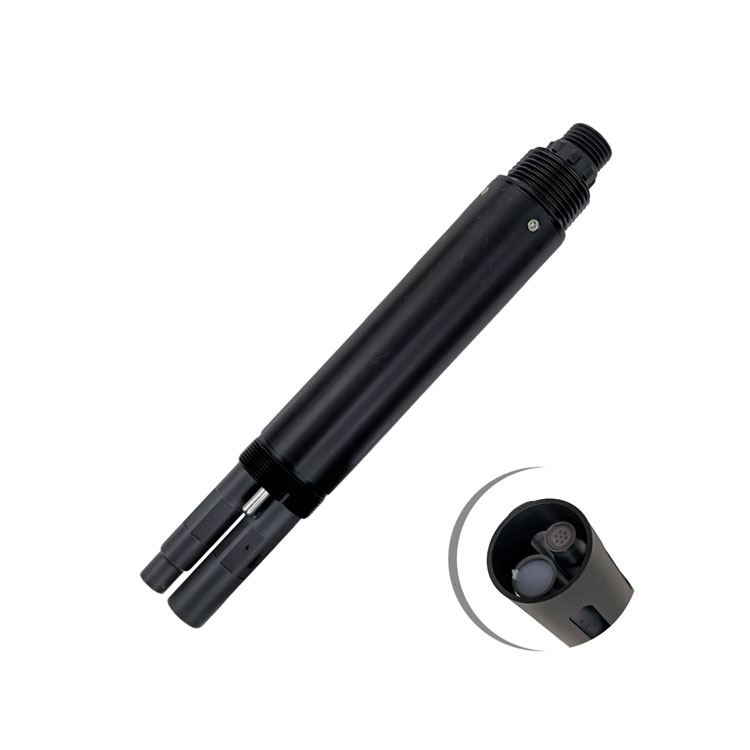
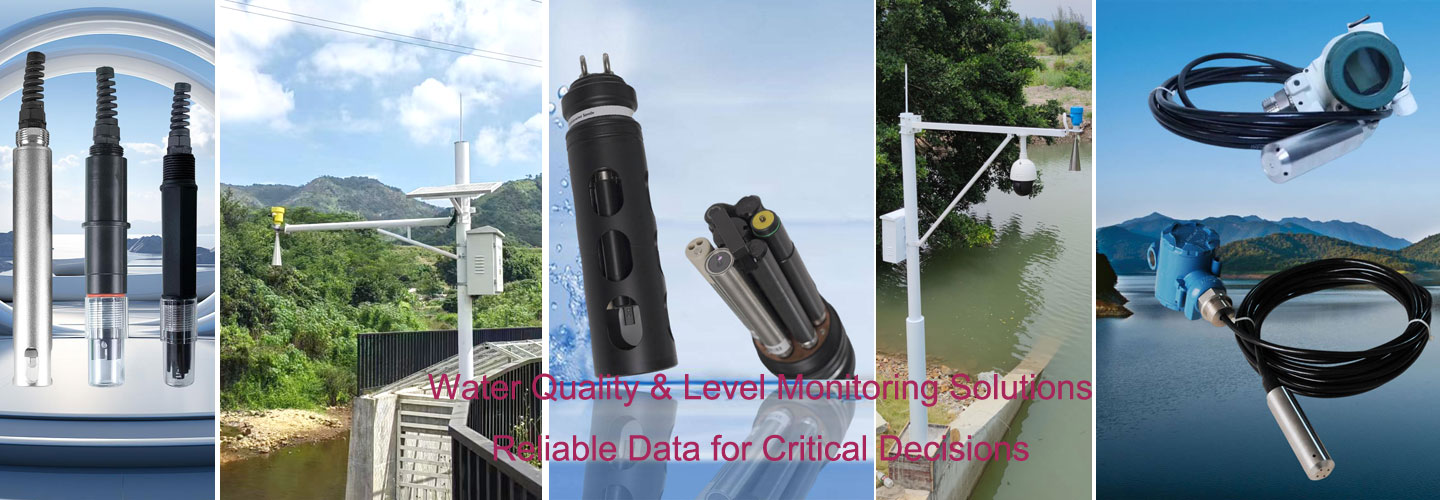
The ammonium probe pictured here measures a separate nitrogen-related quantity. It does not measure filter turbidity. Where the water-source assessment requires both channels, specify each method and range independently; a nitrogen result cannot establish a filter outlet's particle-related performance.
The EPA's guidance on high-quality turbidity data distinguishes individual and combined filter effluent, emphasizes representative sample locations and warns against excessive sample-line delay. It also addresses settings that can conceal genuine excursions. Applicable approval and reporting requirements still need to be established for the project location; a process-monitoring proposal is not evidence of regulatory acceptance.
The RFQ should show the expected low-range NTU band, filter backwash events, pipe or flow-cell layout and cleaning method before the sensor model is locked. Include the smallest change that would prompt an investigation. That change, rather than the number of decimal places on the screen, is the useful starting point for reviewing measurement uncertainty.
For example, a 0.01 NTU display increment does not establish that a sensor can reliably distinguish two process values separated by 0.01 NTU. Resolution describes the reported step size. Accuracy, repeatability, the optical method and installation effects determine whether a small change is meaningful. Increasing the PLC's displayed decimal places does not improve the probe.
| Selection item | NBL-WQ-TS immersion configuration | NBL-WQ-TSA-4 flow-through configuration |
|---|---|---|
| Measuring range | Options: 0-20.00, 0-100.0 or 0-1000.0 NTU | 0-10.000 NTU |
| Resolution | 0.01 NTU on the 20 NTU option; 0.1 NTU on the other two options | 0.001 NTU |
| Accuracy statement | 20 NTU option: +/-3% or +/-1.5 NTU; establish the percentage basis and applicable error rule when specifying | +/-5% or +/-0.02 NTU, whichever is greater; establish the percentage basis for acceptance |
| Installation and protection | Immersion, 3/4 NPT connection, IP68 | Wall-mounted flow-through unit, IP65; not an immersion assembly |
| Digital output | RS485 Modbus RTU | RS485 Modbus RTU; optional 4-20 mA |
| Power supply and consumption | 12-24 VDC; less than 0.3 W at 12 V | 12-24 VDC; 0.2 W at 12 V |
| Pressure and water temperature | Below 0.2 MPa; 0-50 C | Maximum 0.2 MPa; use 0-50 C for preliminary design and confirm the ordered configuration |
| Wetted construction and cable | POM/ABS; standard 5 m cable | Composite construction; five-core shielded cable |
These options are not interchangeable solely because both use infrared scattered-light measurement. The absolute error term of the TS low-range option is material to a filtered-water application. The TSA-4 product specification also gives a 0.1 NTU minimum detection limit; its 0.001 NTU resolution must not be presented as a 0.001 NTU detection capability. Where the required decision lies below the documented capability, obtain a qualified alternative rather than adjusting the wording of the acceptance test.
For drinking-water compliance work, establish the required method, instrument approval and performance at the operating concentration before purchase. Neither an NTU label nor RS485 connectivity demonstrates compliance. Turbidity also does not independently establish microbiological safety or disinfectant residual, so those duties require their own appropriate measurements.
A cabinet beside the control room may be convenient to service but too far from the filter outlet for the intended response. The sensor measures the water arriving at its cell, not the water currently leaving the filter. Include tubing volume, actual sample flow, cell exchange and configured averaging when estimating how quickly a filter event reaches the display.
For a simple illustrative calculation, 10 m of tubing with a 6 mm internal diameter contains approximately 0.283 L. At 0.20 L/min, the nominal tubing residence time is about 1.41 minutes, or 85 seconds, before cell exchange and instrument response are included. This is a transport estimate, not a guaranteed response time. Deposits, restrictions and intermittent flow can make the installed behavior worse.
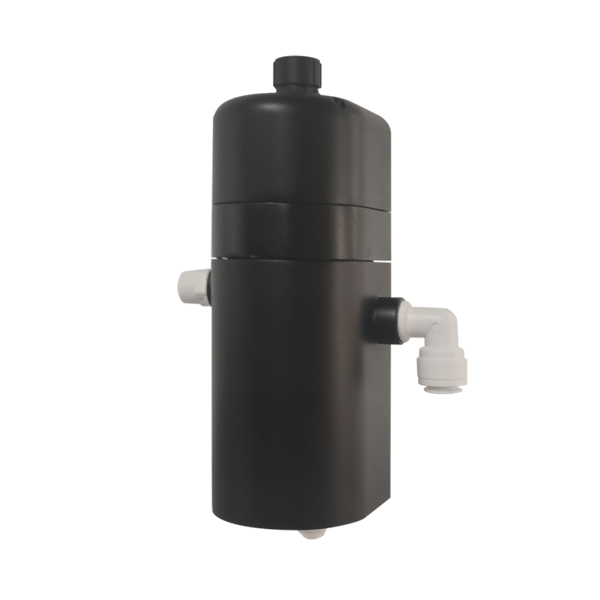
The TSA-4 installation guidance recommends flow below 300 mL/min. Do not increase flow beyond the instrument's allowed conditions simply to compensate for a long sample line. Shorten the route, relocate the panel or redesign the sampling arrangement. Provide a visible way to check flow and a drain arrangement that does not impose unintended backpressure. Check for bubbles after pressure reduction, especially where the takeoff is from a pressurized line.
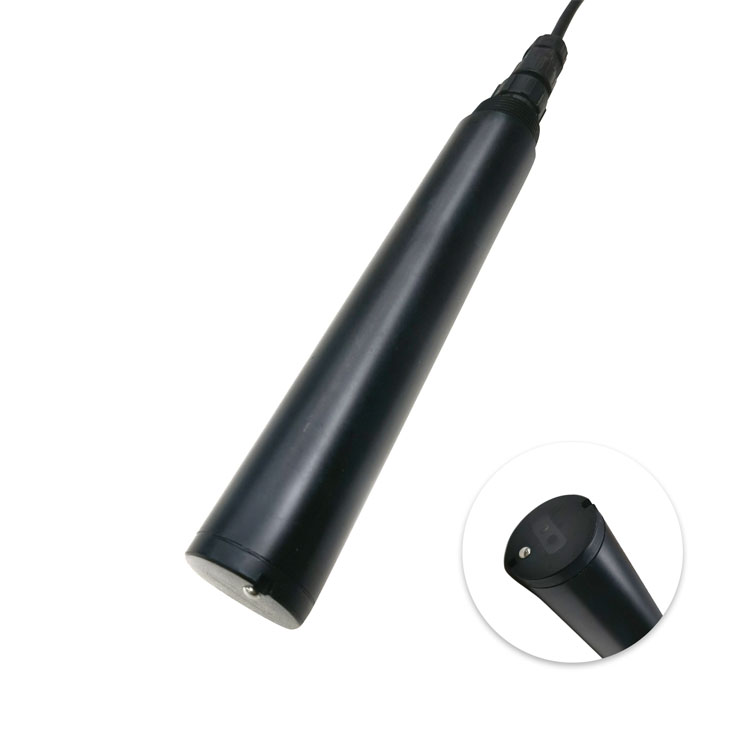
An immersion probe avoids that sample tubing but introduces its own siting requirements. For the TS probe, leave more than 5 cm to the sidewall and more than 10 cm to the bottom around the optical measurement area. A narrow improvised chamber can violate these clearances. Keep the window away from settled deposits and aerated inflows, and provide access for cleaning without changing the measurement location after every visit. For a dedicated sampling panel, review the separate flow-through turbidity installation considerations.
Give each channel a location-specific tag, such as a particular filter outlet, rather than naming all instruments simply "turbidity." Bring the filter's operating state into the historian where available. A rise during backwashing, during filter-to-waste or during normal filtration needs different interpretation; deleting the underlying measurement destroys the ability to investigate it later.
For RS485 Modbus RTU integration, verify the register definition, numeric scaling and unit against the ordered firmware. Compare the local value and the PLC value at more than one concentration. For an optional current-output version, check the assigned 4-20 mA span at both ends. A receiver scaled for 0-100 NTU cannot correctly display a transmitter configured for 0-10 NTU.
Test loss of communication separately from high turbidity. A stale value must not remain indistinguishable from a fresh, stable reading. A commissioning test should show the operator what happens when sample flow stops, the probe is removed for service and the communications cable is disconnected. Any automatic diversion or shutdown logic needs its own plant-approved response, including how it returns to operation.
Ask for a point-by-point quotation listing the sensor range, mounting arrangement, flow cell where required, controller or direct PLC connection, calibration materials and service access provisions. A probe-only price and a complete sampling-panel price describe different purchases. There is no defensible single price for both without defining what the contractor must install.
For a plant expansion, identify which existing channels can be reused and which new filters need dedicated measurement. Share a filter layout, expected NTU interval, available supply pressure, sample-line distance and the receiving PLC interface with NiuBoL. That information allows a configuration discussion before procurement commits to an unsuitable range or an inaccessible installation.
Not when the operating task is to identify a specific filter or assess its return to service. A combined measurement observes the mixed stream and cannot reliably attribute a change to one unit. Define the required diagnostic coverage before reducing the channel count.
No. Review its accuracy terms against the smallest relevant change. A range that includes the expected value is only one selection condition. Method acceptance, low-level uncertainty and installed repeatability must also support the intended decision.
Yes. A precise cell cannot correct water that came from a stagnant branch, an unrepresentative mixing point or an excessively delayed line. Evaluate the tap and the full route to the cell as part of the measurement system.
No. First compare flow, bubbles, filter state and maintenance activity. Preserve the event and its quality flag while investigating. A brief true excursion and a sampling disturbance require different corrections; duration alone does not distinguish them.
Turbidity can contribute process context, but it does not measure residual chlorine or determine the required disinfectant dose by itself. Specify the appropriate disinfectant measurement and treatment-control strategy separately.
Provide the treatment layout, number of independently operated filters, points already monitored, expected water conditions and decisions that need filter-specific information. Include whether the system is for process observation or an approved compliance duty.
Online turbidity sensor selection should leave the plant with identifiable, timely measurements at the points where operators can act. Resolve individual versus combined-filter coverage first, then qualify range, low-level performance, sample delivery and data handling. NiuBoL can review the measuring-point schedule and interface requirements; the selected configuration must meet the actual duty, not merely fit the available panel space.
Prev:Four-Electrode Conductivity Sensor Calibration: Confirm the Cell Design
Next:Turbidity Sensor Calibration and Cleaning for Long-Term Online Monitoring
Related recommendations
Sensors & Weather Stations Catalog
 Agriculture Sensors and Weather Stations Catalog-NiuBoL.pdf
Weather Stations Catalog-NiuBoL.pdf
Agriculture Sensors Catalog-NiuBoL.pdf
Water Quality Sensor Catalog-NiuBoL.pdf
Related products
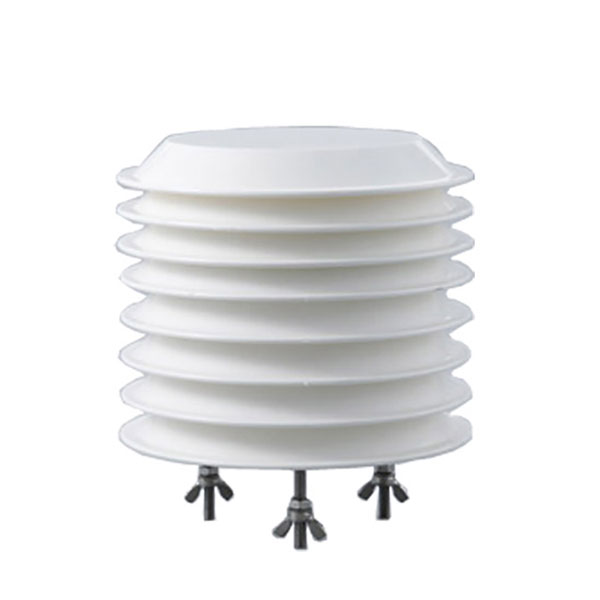 Combined air temperature and relative humidity sensor
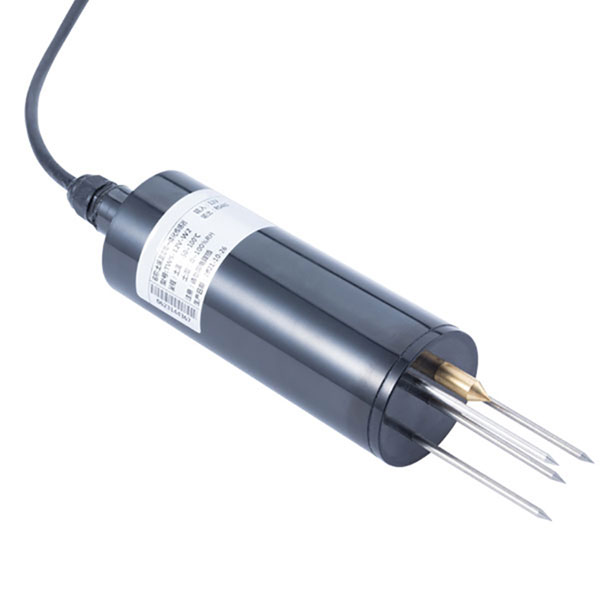 TDR Soil Moisture & Temperature Sensor for irrigation| RS485 |4-20mA| NBL-S-THR
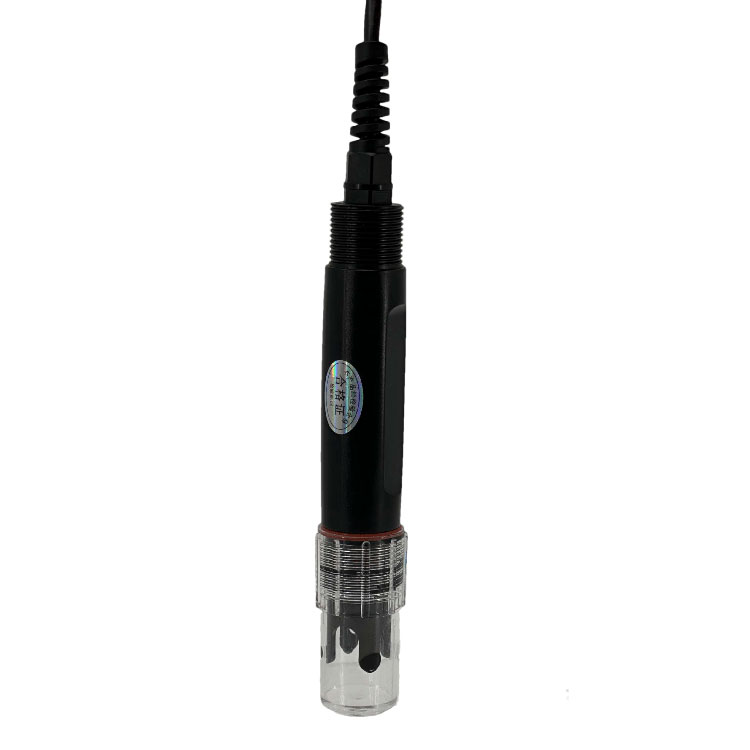 Soil pH sensor RS485 soil Testing instrument soil ph meter for agriculture |NBL-S-PH
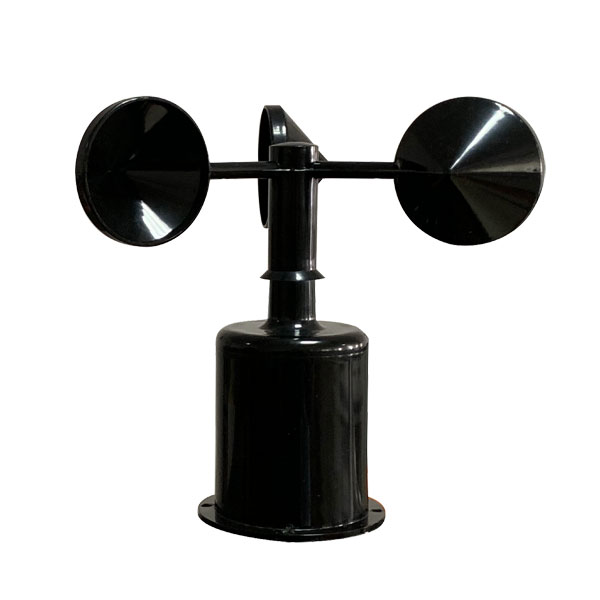 Wind Speed sensor Output Modbus/RS485/Analog/0-5V/4-20mA
 Tipping bucket rain gauge for weather monitoring auto rainfall sensor RS485/Outdoor/stainless steel
 Pyranometer Solar Radiation Sensor 4-20mA/RS485

Screenshot, WhatsApp to identify the QR code
WhatsApp number:+8615367865107
(Click on WhatsApp to copy and add friends)