

— Blogs —
—Products—
 Consumer hotline +8618073152920
WhatsApp:+8615367865107
Address:Room 102, District D, Houhu Industrial Park, Yuelu District, Changsha City, Hunan Province, China
Product knowledge
Time:2026-09-20 11:00:00 Popularity:205
When effluent COD suddenly increases, first determine whether the change appears in a fresh online optical reading, a representative laboratory sample, or both. Preserve the event data and follow the site's response procedure while checking the sample point, optical window, bubbles and recent process changes. Do not immediately recalibrate the sensor or change aeration solely to make the displayed COD fall. Those actions can hide the cause or introduce a second problem.
An online COD estimate, a laboratory chemical COD result and an organic mass load are different observations. Establish which one triggered the investigation. A high number at the control-room screen may reflect a real water change, an invalid instrument state, a scaling change or a sample that no longer represents the discharge.
Check the timestamp and data quality before interpreting the value. Compare the local instrument response with the PLC or historian. If the reading jumped immediately after a controller change, range adjustment or register remapping, investigate that change alongside the water. Do not dismiss a possible discharge event simply because a software explanation is convenient.
Save the period before and after the event, including the raw available values, alarm state, maintenance activity and process timestamps. Obtain a representative sample promptly using the site's sampling procedure. Operational containment or notification duties should follow the plant's approved plan; waiting for a sensor investigation must not replace that response.
| Observed pattern | Possible explanation | Next discriminating check |
|---|---|---|
| Online COD rises together with turbidity | Particle carryover, changed optical interference, bubbles or a genuine mixed event | Inspect the water and compare representative COD and solids results; check clarifier and filter events |
| Online COD rises but turbidity stays steady | Changed dissolved optical response, window contamination or a composition change | Check the window and paired laboratory COD; review production and chemical-use records |
| Laboratory COD rises but the optical trend does not | A weakly represented optical component, different sample timing or analytical interference | Reconcile sample basis and time; request laboratory quality-control review and evaluate the optical relationship |
| A brief spike coincides with cleaning or air release | Temporary disturbance near the optical path | Inspect cleaning and bubble conditions; preserve the spike and establish whether the water also changed |
| All displayed channels freeze, then jump | Communication loss, restart or buffered data arriving late | Check timestamps, connection logs and the difference between measurement time and upload time |
These patterns identify investigations, not diagnoses. A turbidity rise does not prove that all of the COD increase is particulate, and steady turbidity does not prove that biological treatment failed. Several causes can occur together, particularly during a process upset or a change in industrial wastewater composition.
Collect the comparison at the online measuring point or demonstrate that the alternative tap represents the same water. A sample from an upstream chamber taken later in the shift may be perfectly analyzed yet unsuitable for checking the event. Include transport delay where a sample line separates the process from the sensor.
Identify whether the laboratory result describes an unfiltered sample or a defined filtered fraction. Removing particles changes the question being asked. If the investigation compares filtered and unfiltered COD, keep both results labeled with their preparation methods; do not replace the required reporting result with the lower value.
Suspended material can settle between collection and preparation, making one aliquot different from another. Ask the laboratory to follow the appropriate sample preparation and quality-control procedure rather than improvising a field adjustment to the online reading. Preserve samples and arrange analysis according to the selected method, not a universal storage assumption.
Chemical analysis also has limitations. EPA Method 410.4 identifies chloride as a positive interference in its dichromate determination. If an unusual saline stream is suspected, tell the laboratory so that method suitability and interference control can be reviewed. That possibility is a reason to investigate the result, not permission to disregard it.
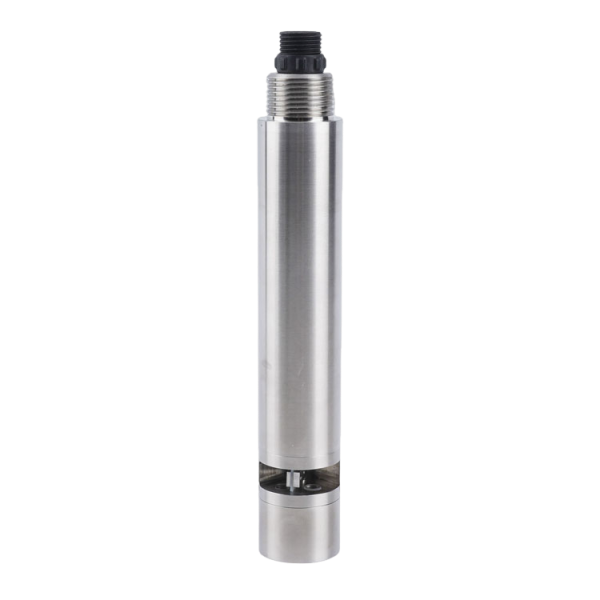
Record the as-found reading and visible condition before cleaning. Look for coating, trapped debris, a stalled or damaged brush and bubbles attached to the measurement area. Confirm that the probe is still submerged and has not shifted into a wall, deposit or aerated zone.
For the NBL-WQ-COD and COD-408-S immersion arrangements, secure the probe so that flow cannot swing it against surrounding structures. Their installation guidance places the probe no more than 2 m below the surface and about 30 cm below the lowest expected water level. A pressure rating alone is not a reason to ignore the installation-depth guidance.
Clean the accessible optical surfaces using the appropriate gentle procedure, then recheck under stable conditions. If the reading changes markedly after cleaning, fouling contributed to the observed response. That does not establish that no real water event occurred earlier. Retain the before-and-after results and the comparison sample.
A reference-solution check evaluates instrument response; a wastewater comparison evaluates the site's optical-to-COD relationship. Passing one does not automatically pass the other. Recalibrating against a single anomalous sample can force temporary agreement while making the normal operating trend less reliable.
Confirm the probe identity before using another channel to investigate the event. The residual-chlorine electrode below cannot verify a COD concentration; it has a different analytical duty.
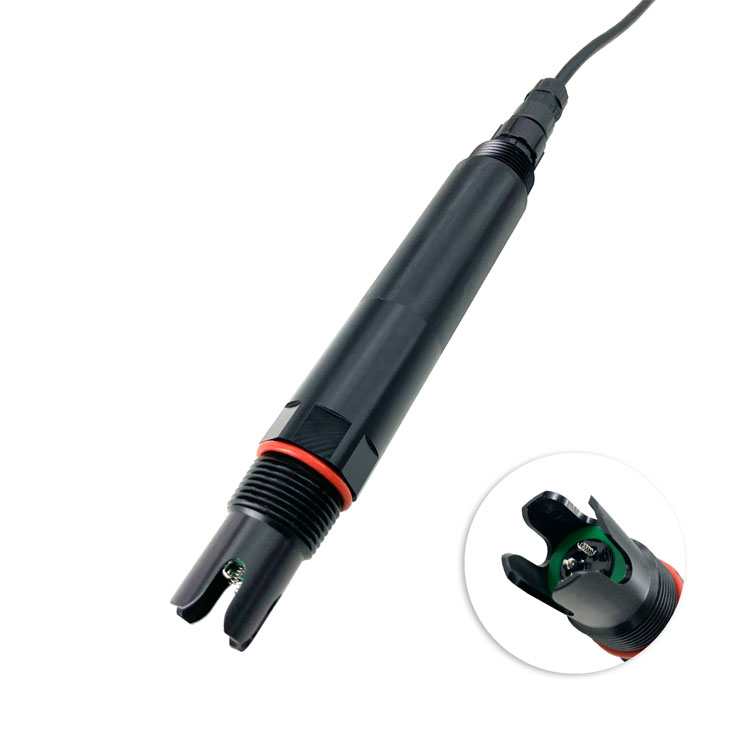
The NiuBoL NBL-WQ-COD-408-S uses dual-wavelength UV absorption with a turbidity reference and cleaning brush. It can contribute frequent observations to an investigation, but its optical COD estimate does not identify a specific pollutant or establish the cause of a treatment upset.
| Instrument item | COD-408-S configuration | Why it matters during an event |
|---|---|---|
| COD and paired turbidity spans | 0-200 mg/L and 0-200 NTU; 0-500 mg/L and 0-400 NTU; 0-1500 mg/L and 0-1000 NTU | Identify the ordered pair before interpreting saturation or an out-of-range event |
| COD reference and resolution | KHP-equivalent calibration; 0.1 mg/L resolution | Decimal places do not establish accuracy on changed wastewater |
| Accuracy | Range-dependent; agree the selected range's error basis and reference conditions | Do not apply one percentage expression to every configuration or matrix |
| Communication | RS485 Modbus RTU; optional 4-20 mA | Compare the same parameter, unit and scale at the sensor and host |
| Supply and consumption | 12-24 VDC; 0.4 W measurement, 2 W cleaning at 12 V | Check for supply problems coinciding with cleaning, especially on remote power systems |
| Water limits | 0-60 C; maximum 0.2 MPa | Investigate conditions outside the instrument's working envelope |
| Construction | 316L stainless steel; IP68; immersion, 3/4 NPT; standard 5 m five-core shielded cable | Inspect the mount and cable without opening the sealed sensor body |
For the basic NBL-WQ-COD version, the water limits are narrower: 0-45 C and pressure below 0.1 MPa. Its 0-200 and 0-500 mg/L COD configurations have paired turbidity spans of 0-100 and 0-200 NTU. Read the installed model and range rather than borrowing limits from a similar-looking probe.
If paired results support a genuine change, compare the effluent event with upstream conditions while allowing for hydraulic travel and mixing. A production change at noon need not produce an immediate effluent change at noon. Use actual plant operating information to estimate the relevant interval instead of matching events only by clock time.
Review unusual inflow, bypasses, tank drawdown, production discharge, chemical dosing and solids-separation performance. Rising effluent particles can justify examining sludge carryover or filtration, while a changed dissolved fraction may direct attention elsewhere. Use DO, pH, temperature and flow where they answer a specific hypothesis, not as a list of extra sensors that supposedly proves the cause.
Keep concentration and mass loading distinct. As an illustrative calculation, 40 mg/L at 1000 m3/day corresponds to 40 kg/day. A later 60 mg/L at 500 m3/day corresponds to 30 kg/day. Concentration has increased while the calculated daily load has decreased. The example does not excuse a concentration exceedance; it shows why a process-load investigation needs the associated flow and averaging period.
An effluent COD increase alone is insufficient reason to increase aeration. If the cause is particulate carryover, a poorly represented compound or an instrument fault, more air may not address it. Any treatment adjustment should follow the established operating procedure and the evidence for the suspected mechanism.
Keep the original trend, paired analytical results and a timeline of inspections or changes. Identify whether the investigation found a process event, a measurement problem, a data-path problem or an unresolved combination. A return to a normal displayed value is not, by itself, a complete explanation.
For technical support, send NiuBoL the exact model and range, event timestamps, COD and turbidity trends, comparison method and results, installation photographs and the outcome of the window inspection. These details help distinguish a service issue from a method limitation. Do not order a wider-range probe solely because a transient peak appeared before establishing whether the existing channel saturated.
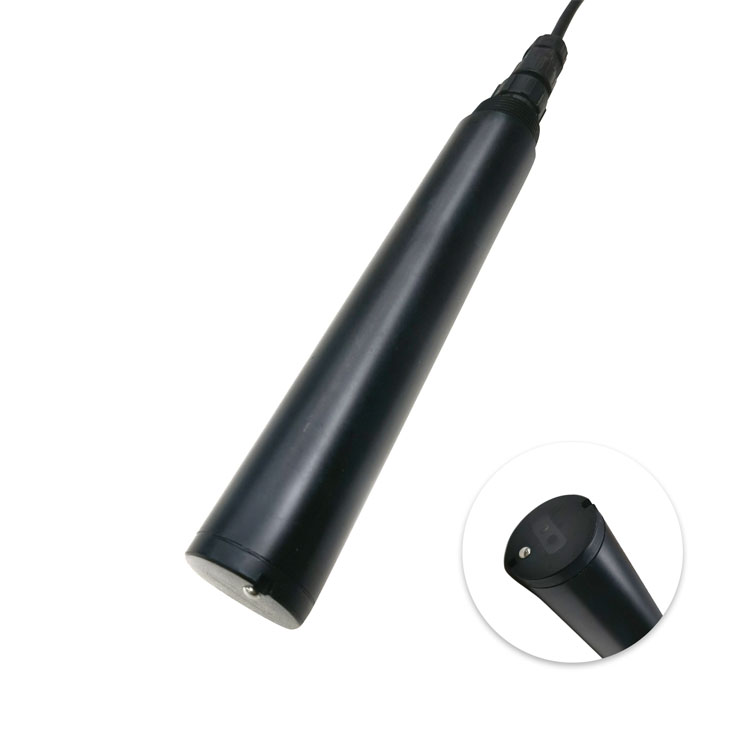
The separate turbidity probe below can provide useful particle context at a suitable point. A turbidity change can guide where to sample, but there is no universal NTU-to-COD conversion that can replace the paired investigation.
It is an event requiring the site's prescribed response, but an optical estimate alone does not establish every method-defined reporting result. Check data validity and obtain the appropriate comparison without delaying required operational action.
The changed material may not be represented well by the optical relationship, or the samples may differ in time or preparation. Analytical interference is another possibility. Reconcile those factors before deciding that either result is wrong.
No. Inspect and verify the instrument, then compare representative paired samples. One result collected under an unusual condition does not establish a new conversion for all subsequent wastewater.
A properly defined filtered-versus-unfiltered comparison can help investigate the contribution associated with particles. Keep the analytical methods and sample fractions explicit. It must not be used to substitute a different result for the required sample basis.
Examine fouling, bubbles and cleaning-related data states, but retain the original event. A changed reading after cleaning shows that measurement conditions changed; it does not prove that the water was unchanged throughout the earlier interval.
Yes. Mass load depends on both concentration and flow. Use values representing the same stream and period, and distinguish a daily load estimate from an instantaneous concentration alarm.
Consider replacement after repeatable verification identifies a fault, service cannot restore performance, or the required water conditions exceed the selected model's capability. A changed wastewater correlation may need a different method rather than another identical probe.
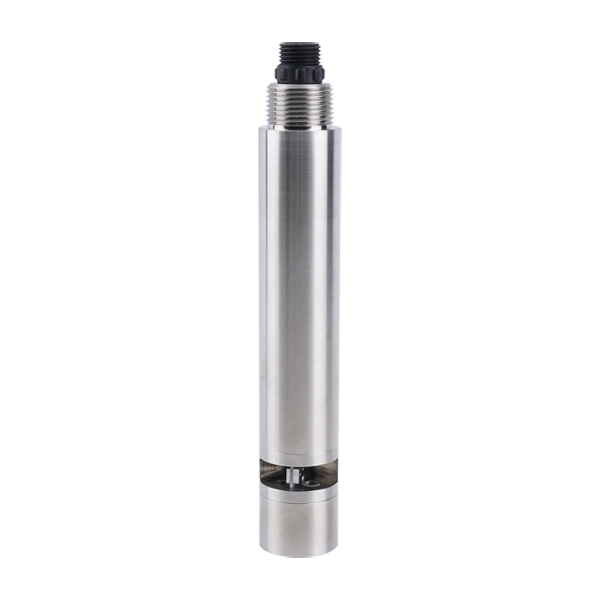
When effluent COD suddenly increases, preserve the event, verify the measurement path and compare representative samples before assigning a cause. Use optical COD for timely observation, supporting channels for specific diagnostic questions and the required analytical method for its defined result. Correct the identified problem without calibrating away the evidence that revealed it.
Prev:COD, BOD, TOC and Turbidity in One Online Sensor: When It Makes Engineering Sense
Next:Online Ammonia Nitrogen Sensor: Can One Configuration Serve Several Sites?
Related recommendations
Sensors & Weather Stations Catalog
 Agriculture Sensors and Weather Stations Catalog-NiuBoL.pdf
Weather Stations Catalog-NiuBoL.pdf
Agriculture Sensors Catalog-NiuBoL.pdf
Water Quality Sensor Catalog-NiuBoL.pdf
Related products
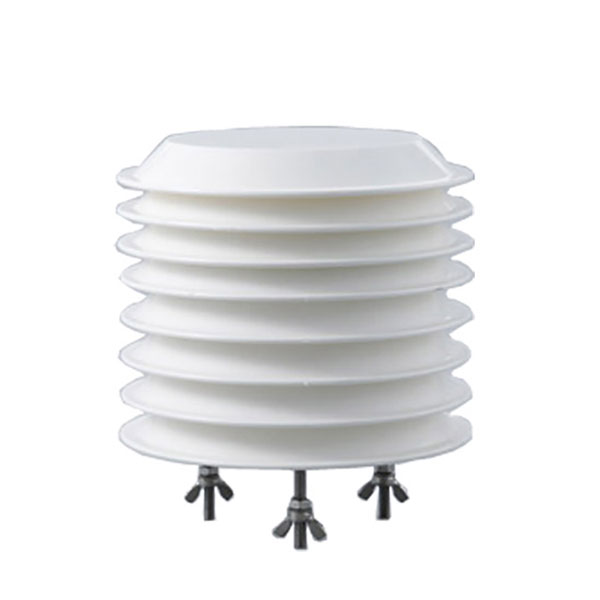 Combined air temperature and relative humidity sensor
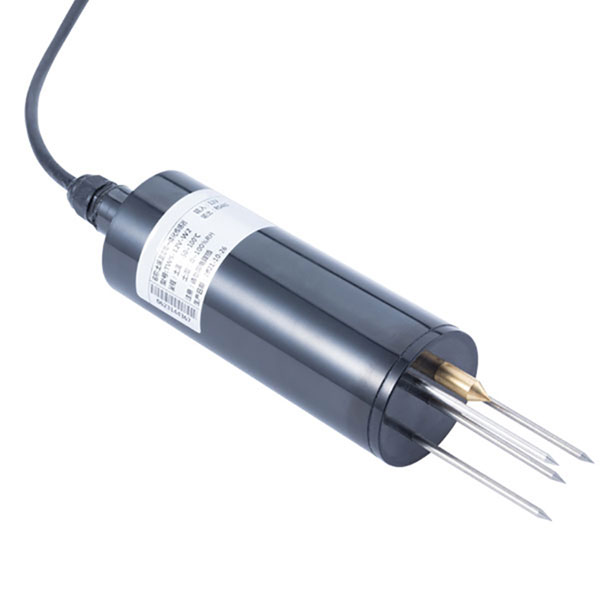 TDR Soil Moisture & Temperature Sensor for irrigation| RS485 |4-20mA| NBL-S-THR
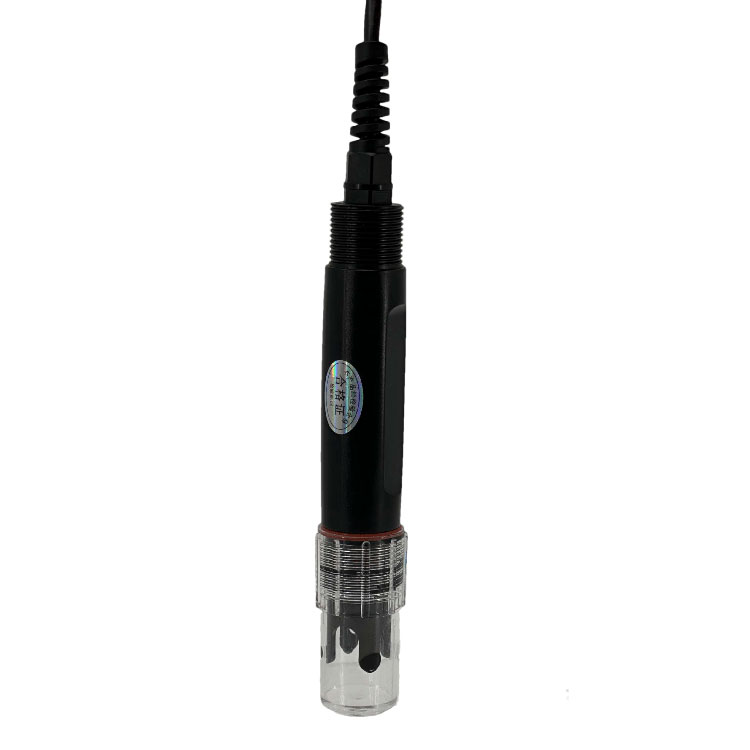 Soil pH sensor RS485 soil Testing instrument soil ph meter for agriculture |NBL-S-PH
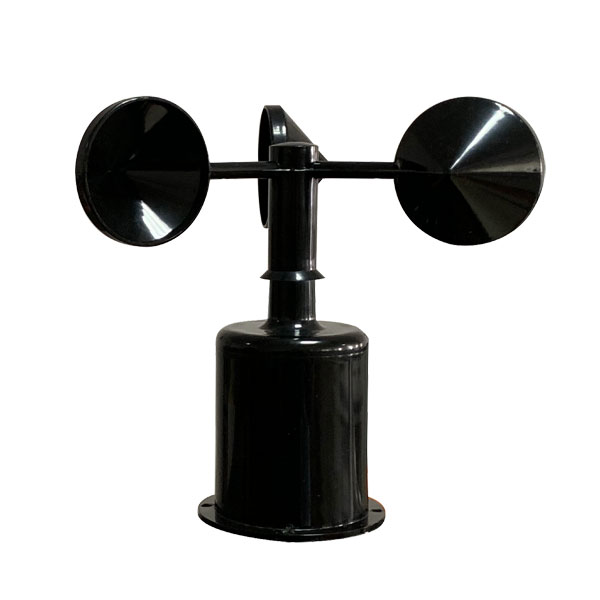 Wind Speed sensor Output Modbus/RS485/Analog/0-5V/4-20mA
 Tipping bucket rain gauge for weather monitoring auto rainfall sensor RS485/Outdoor/stainless steel
 Pyranometer Solar Radiation Sensor 4-20mA/RS485


Screenshot, WhatsApp to identify the QR code
WhatsApp number:+8615367865107
(Click on WhatsApp to copy and add friends)