

— Blogs —
—Products—
 Consumer hotline +8618073152920
WhatsApp:+8615367865107
Address:Room 102, District D, Houhu Industrial Park, Yuelu District, Changsha City, Hunan Province, China
Product knowledge
Time:2026-09-23 12:00:00 Popularity:195
Quick Answer: Industrial wastewater monitoring points should follow the treatment decisions: detect incoming disturbances before equalization, measure the mixed water entering treatment, monitor the biological or chemical reaction where it occurs, and check clarified water before discharge. Installing the same sensor package at every tank adds maintenance without necessarily revealing where a problem started. Select each parameter against the action an operator can take at that location.
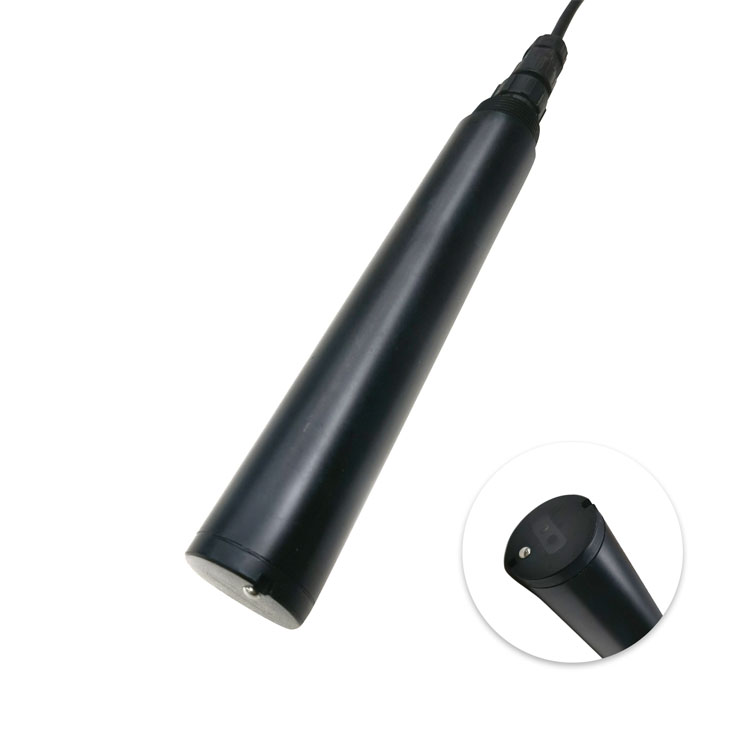
A treatment plant can meet its average operating targets and still struggle with a short production discharge. A cleaning cycle may change pH, a saline stream may increase conductivity, or a batch wash may carry organic matter and suspended solids. A sensor at the final outlet shows the consequence; an upstream point can give operators time to isolate or redistribute the incoming load. Neither location replaces the other.
For an engineering contractor, the first drawing should therefore show production drains, equalization, treatment stages, recycles and the final outlet, with the proposed action written beside each instrument. If a high reading cannot trigger an investigation, a sampling task or a defined process adjustment, reconsider whether that channel needs continuous measurement.
Separate dedicated high-risk streams before deciding to monitor the combined influent. Dilution in a common sewer can hide the source of a disturbance. Conversely, measuring only a small aggressive side stream will not describe the water actually entering the biological plant. The useful arrangement depends on whether the immediate objective is source tracing or treatment control.
| Point | Measure and act | Site risk |
|---|---|---|
| Combined influent, after coarse screening | Use pH, conductivity and temperature to detect an incoming change; add organic-load or solids channels when justified | Rags, grease and intermittent flow can foul or expose the probe |
| Mixed equalization outlet | Use pH, conductivity and a validated organic-load trend to assess water feeding the next stage | An unmixed corner does not represent the pump discharge |
| Aerobic or anoxic zone | Use DO, ORP or nitrogen channels according to the reaction stage to investigate aeration, mixing or treatment | Air bubbles, settled solids and poor zone selection distort the result |
| Clarifier or tertiary outlet | Use turbidity, or TSS where mass concentration is needed, to detect solids carryover | A surface sample may miss the flowing outlet stream |
| Final discharge or reuse outlet | Measure the required outlet parameters and provide a nearby sample point to investigate excursions | Backwater, stagnant channels or an unsuitable sample branch |
This is a location map, not a requirement to purchase every listed sensor. A neutralization plant without biological treatment does not need an aeration-control DO channel. A reuse system may require an additional downstream quality check after filtration or disinfection. The discharge authorization and process design determine which results are operational indicators and which need an approved analytical method.
Pair a concentration trend with flow when the purpose is estimating incoming load. For a steady interval, load in kg/h equals concentration in mg/L multiplied by flow in m3/h, divided by 1,000. As an illustrative calculation, 400 mg/L at 25 m3/h is 10 kg/h; 250 mg/L at 60 m3/h is 15 kg/h. The lower concentration can represent the larger load.
This calculation is only as representative as its inputs. A local optical COD estimate and a total-plant flow meter may describe different streams. If flow and concentration vary quickly, calculate interval loads using aligned records instead of multiplying unrelated daily averages. For a diversion decision, also establish how much water can pass between detection, operator response and valve movement.
Across equalization and biological treatment, simultaneous timestamps do not mean the same water parcel. Tank mixing, variable levels and recycle flows spread and delay a disturbance. Use level, pump and production records to interpret a change. Do not claim removal efficiency by subtracting the current inlet reading from the current outlet reading during a rapidly changing batch discharge.
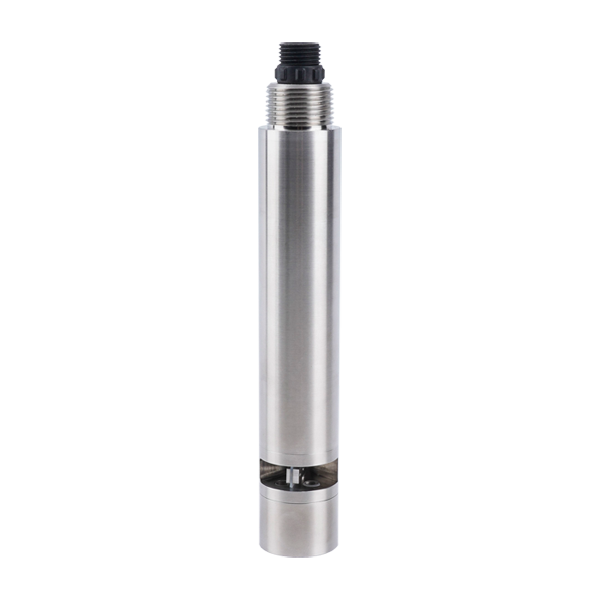
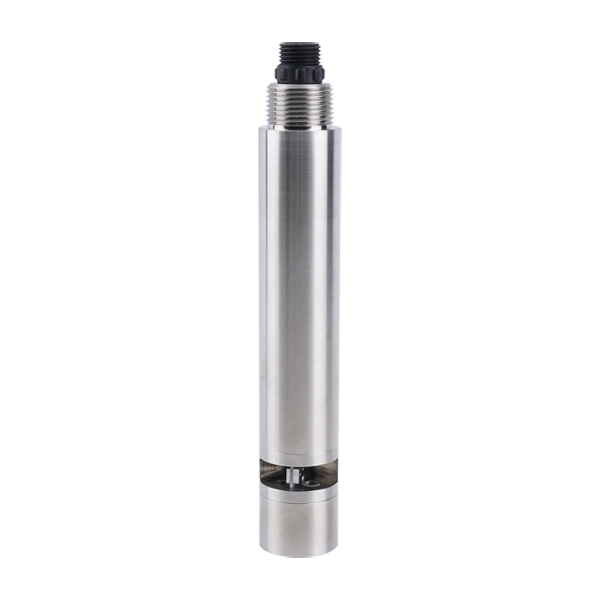
The NiuBoL NBL-WQ-COD-408-S uses ultraviolet absorption with a second optical channel for turbidity compensation. It is useful for tracking changes after the relationship with the site's wastewater has been established. Its optical response is not a universal measurement of every compound contributing to laboratory COD. Changes in dye, organic composition or suspended matter can change that relationship.
Collect paired online and laboratory results across ordinary production, cleaning periods and expected high-load conditions. A calibration based only on clear, stable effluent may not transfer to dark influent. If the intended alarm concerns a discharge limit, assess the error near that limit, not merely the overall correlation across a wide concentration range.
| NBL-WQ-COD-408-S characteristic | Technical detail | Effect on point selection |
|---|---|---|
| COD range options | 0-200, 0-500 or 0-1500 mg/L, equivalent KHP | Select the ordered range around normal conditions and credible excursions; these are not three interchangeable readings from every unit |
| Measurement agreement | Range-dependent accuracy; wastewater-specific comparison is necessary | Set a project acceptance tolerance for the intended water matrix and alarm region |
| Supply and output | 12-24 VDC; RS485 Modbus RTU; optional 4-20 mA | Check the purchased output option and controller interface before wiring |
| Power at 12 V | 0.4 W while measuring; 2 W during cleaning | Size the supply for cleaning demand, including simultaneous devices |
| Operating environment | 0-60 C; pressure at or below 0.2 MPa; IP68 | Do not transfer these ratings to the cabinet, cable joint or an unrestricted process pipeline |
| Housing and connection | 316L stainless steel; 3/4-inch NPT immersion connection | Assess chemical compatibility and provide a retrievable mounting assembly |
| Cable | Standard 5 m, five-core shielded cable | Keep the termination dry and avoid supporting the probe by its cable |
A self-cleaning brush addresses deposits on the optical surface; it does not correct a poor sampling location or eliminate every interference. Allow clearance for the brush and access for inspection. Where wastewater composition changes between production lines, retain separate comparison records for those operating conditions rather than forcing one correction onto all of them.
Use a mixed, flowing region that represents the outlet or reaction zone, while avoiding direct impact from an inlet jet or aerator plume. Do not solve an unstable signal by moving the probe into a quiet, isolated corner. Inspect it at low and high operating levels and during mixer changes. A location that works with a full tank may expose the sensing surface during drawdown.
For the NBL-WQ-COD-408-S immersion arrangement, place the sensing area at least 30 cm below the lowest working water level and within the specified installation depth, up to 2 m. Secure the probe so that changing flow cannot swing it against concrete or piping. These dimensions belong to this probe arrangement, not to every water-quality sensor in the station.
Position the probe in water that reaches the discharge measurement section, not in sediment beneath it. If a pumped side stream is necessary, provide visible flow confirmation and a sample outlet near the sensor. Strainers, settling chambers and long tubing can remove or alter the very solids the channel is intended to detect. Evaluate the complete sampling path before interpreting a clear-water reading as successful clarification.
Keep turbidity and TSS labels distinct. Turbidity measures an optical response, while TSS is a mass concentration determined by the selected method. A site correlation may be useful within a stable solids composition, but changing particle size or color can invalidate a fixed conversion. A PLC should not relabel an NTU register as mg/L simply because the display has spare decimal places.
Give each RS485 Modbus RTU channel a location-specific tag, such as equalization outlet COD, rather than only a model number. Record the engineering unit, range, update time and calibration or cleaning state. A stale value must not appear as a fresh normal result. During brush operation, apply the manufacturer's data-handling instructions and mark any intentionally excluded interval.
Several patterns deserve different responses. High outlet turbidity with stable upstream organic-load trends suggests a solids-separation investigation. A sudden conductivity change at the influent followed later at equalization points toward an incoming dissolved-ion change. Several sensors freezing at once, especially with lost sample flow, points first to the sampling or communications system. These are diagnostic starting points, not automatic proof of a process cause.
Commission each location using an accessible comparison sample and the same water interval. Challenge the data path with a controlled sensor disconnection and, on pumped systems, loss of sample flow. Verify that the operator receives a distinct invalid-data alarm. Do not intentionally upset the treatment process to demonstrate an alarm; use approved simulation or comparison procedures.
It may cover an outlet-monitoring task, but it cannot reliably identify which upstream stage caused an excursion. Add points where earlier information changes an available action, such as isolating an incoming batch or investigating clarification. A small plant with stable influent may need fewer points than a multi-line factory.
Not automatically. Influent excursions may require a wider range, while the outlet needs useful discrimination close to its operating or alarm level. Compare the expected values and required error at both locations. Select and validate each ordered range rather than using one broad range solely to simplify purchasing.
Not as a universal substitution. A local relationship can support operational trending if particle composition remains sufficiently consistent. Retain the required laboratory method for reporting and reassess the relationship after process or feedstock changes. Use a separately specified TSS channel when continuous mass-concentration indication is the actual requirement.
Assign unique addresses, match serial settings and implement each model's register format and scaling. Test one probe before adding the others. Check the full bus under cleaning and pump operation, and display communication failure separately from an acceptable process reading. RS485 compatibility alone does not supply a common register map.
Send a treatment-flow drawing, the purpose of each point, expected concentration ranges, liquid temperature and chemistry, available mounting access and the PLC or RTU interface. Include whether the proposed sample is immersed or pumped. This allows NiuBoL to quote the appropriate probes and connections without assuming that one package fits every tank.
Only where the applicable monitoring procedure accepts that measurement method and installation. Process sensors can provide early warnings and useful records, but they do not automatically replace prescribed sampling, laboratory analysis or reporting. Agree the operational and regulatory roles before acceptance testing.
Effective industrial wastewater monitoring points explain both where water quality changed and what the plant can do next. Preserve the distinction between source detection, reaction control, solids separation and final-discharge assessment. NiuBoL sensor selection should follow that point-by-point duty, with representative sampling, suitable ranges and a data path that identifies invalid measurements instead of hiding them.
Prev:RAS Water Quality Monitoring for Shrimp and Fish Farms
Next:Cooling Water Monitoring: Conductivity, pH, ORP and Scaling Risk Control
Related recommendations
Sensors & Weather Stations Catalog
 Agriculture Sensors and Weather Stations Catalog-NiuBoL.pdf
Weather Stations Catalog-NiuBoL.pdf
Agriculture Sensors Catalog-NiuBoL.pdf
Water Quality Sensor Catalog-NiuBoL.pdf
Related products
 Combined air temperature and relative humidity sensor
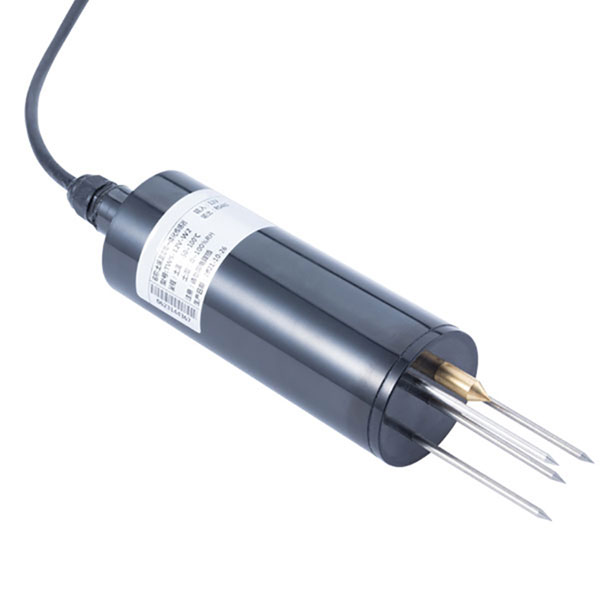 TDR Soil Moisture & Temperature Sensor for irrigation| RS485 |4-20mA| NBL-S-THR
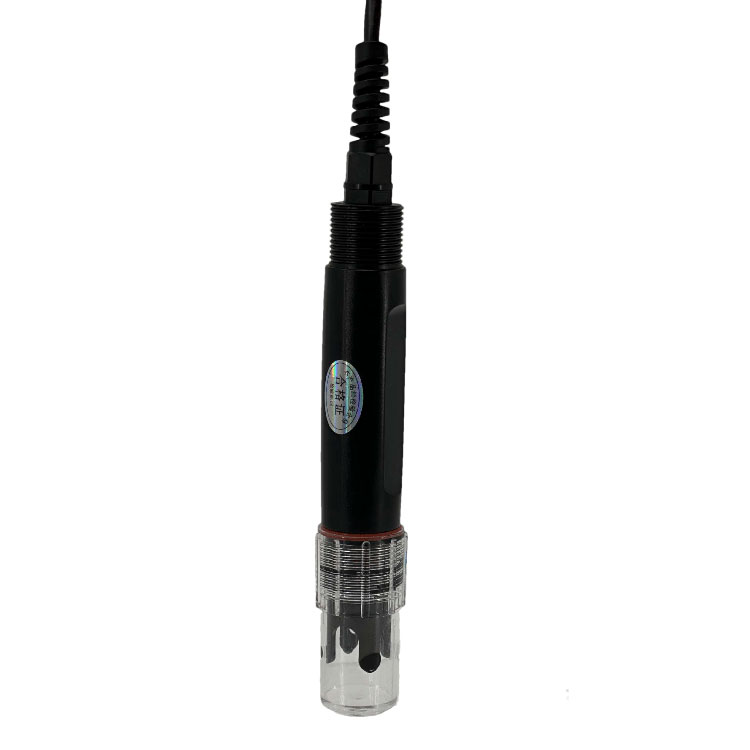 Soil pH sensor RS485 soil Testing instrument soil ph meter for agriculture |NBL-S-PH
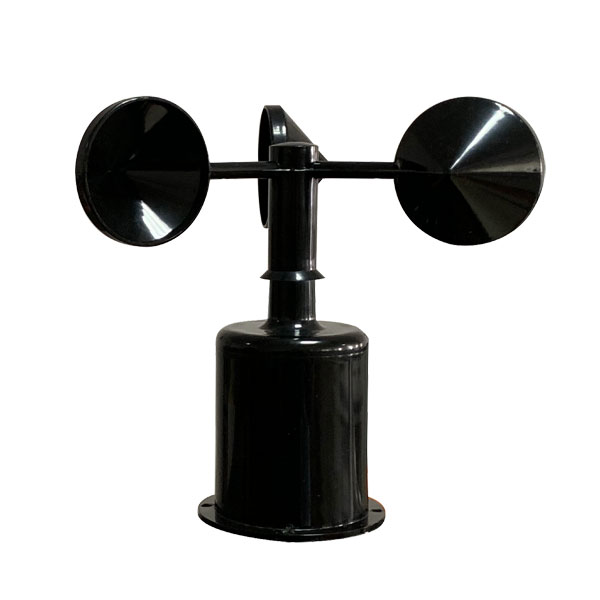 Wind Speed sensor Output Modbus/RS485/Analog/0-5V/4-20mA
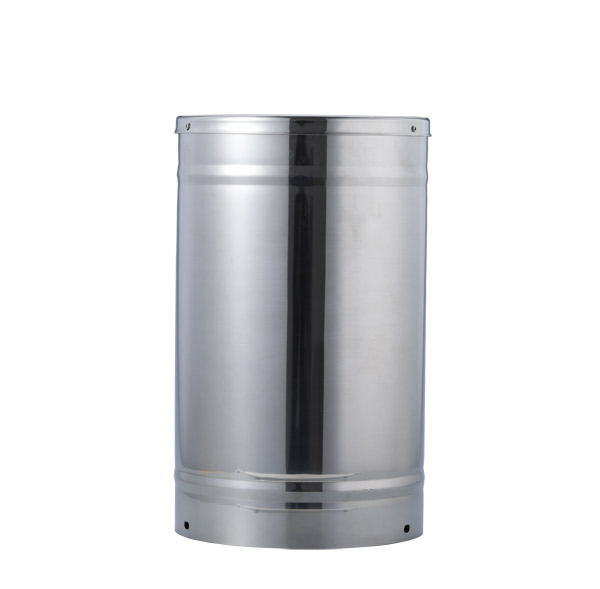 Tipping bucket rain gauge for weather monitoring auto rainfall sensor RS485/Outdoor/stainless steel
 Pyranometer Solar Radiation Sensor 4-20mA/RS485


Screenshot, WhatsApp to identify the QR code
WhatsApp number:+8615367865107
(Click on WhatsApp to copy and add friends)