





— Blogs —
—Products—
 Consumer hotline +8618073152920
WhatsApp:+8615367865107
Address:Room 102, District D, Houhu Industrial Park, Yuelu District, Changsha City, Hunan Province, China
Product knowledge
Time:2025-03-18 10:56:00 Popularity:1332
A tourist attraction weather station should give staff useful local observations and visitors clearly labelled information. Select measurements for the location and the decisions they support, then define how the public screen handles units, update time and unavailable data. Environmental readings should not be presented as health benefits, forecasts or automatic confirmation that a route is safe.
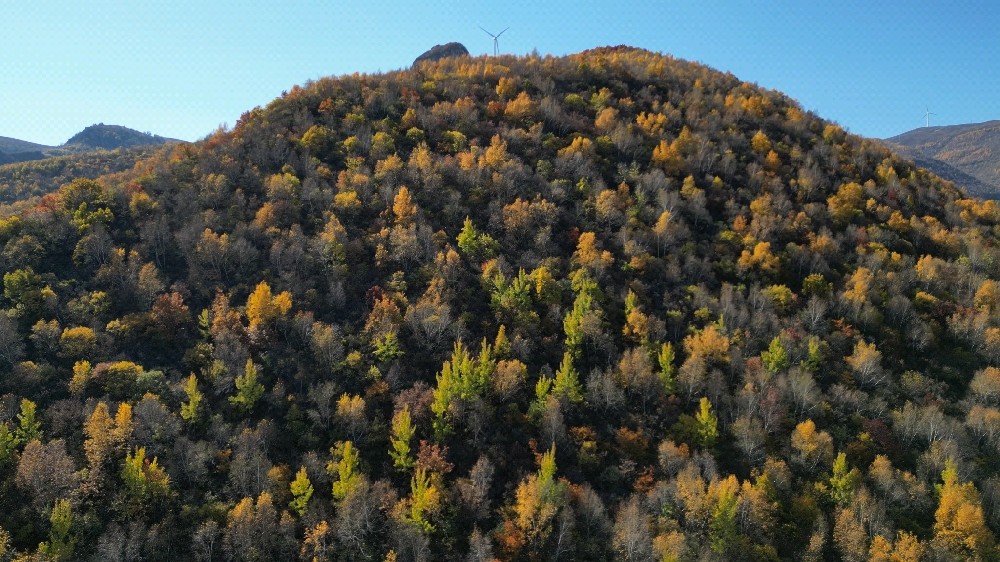
A screen near a park entrance may show air temperature, humidity, wind and recent rainfall, while staff need a longer record to plan maintenance or inspect trails. Those are related but different uses. A single display packed with every available sensor can make the information harder to interpret, especially if the instruments are installed far from the entrance.
Start with a short display schedule: parameter, unit, observation location, update time and intended audience. Label a shaded garden reading as that location rather than the temperature of the entire mountain. A viewpoint and a wooded valley may require separate observations if both influence daily operations. Do not average them into one apparently precise value without explaining what it represents.
| Observation | Useful application | Interpretation limit |
|---|---|---|
| Air temperature and humidity | Local conditions at an entrance, garden or work area | Not a complete assessment of heat stress or personal comfort. |
| Wind speed and direction | Context for exposed viewpoints and outdoor maintenance | A sheltered garden sensor may underrepresent an exposed ridge. |
| Rainfall | Recent precipitation history and grounds inspection planning | Not a direct measurement of stream level or slope stability. |
| Solar irradiance | Radiation records for landscape or research work | Broadband irradiance is not UV Index. |
| Optional particulate or air-ion channels | A defined environmental observation programme | Each quantity needs its own instrument and meaning; none is a general health score. |
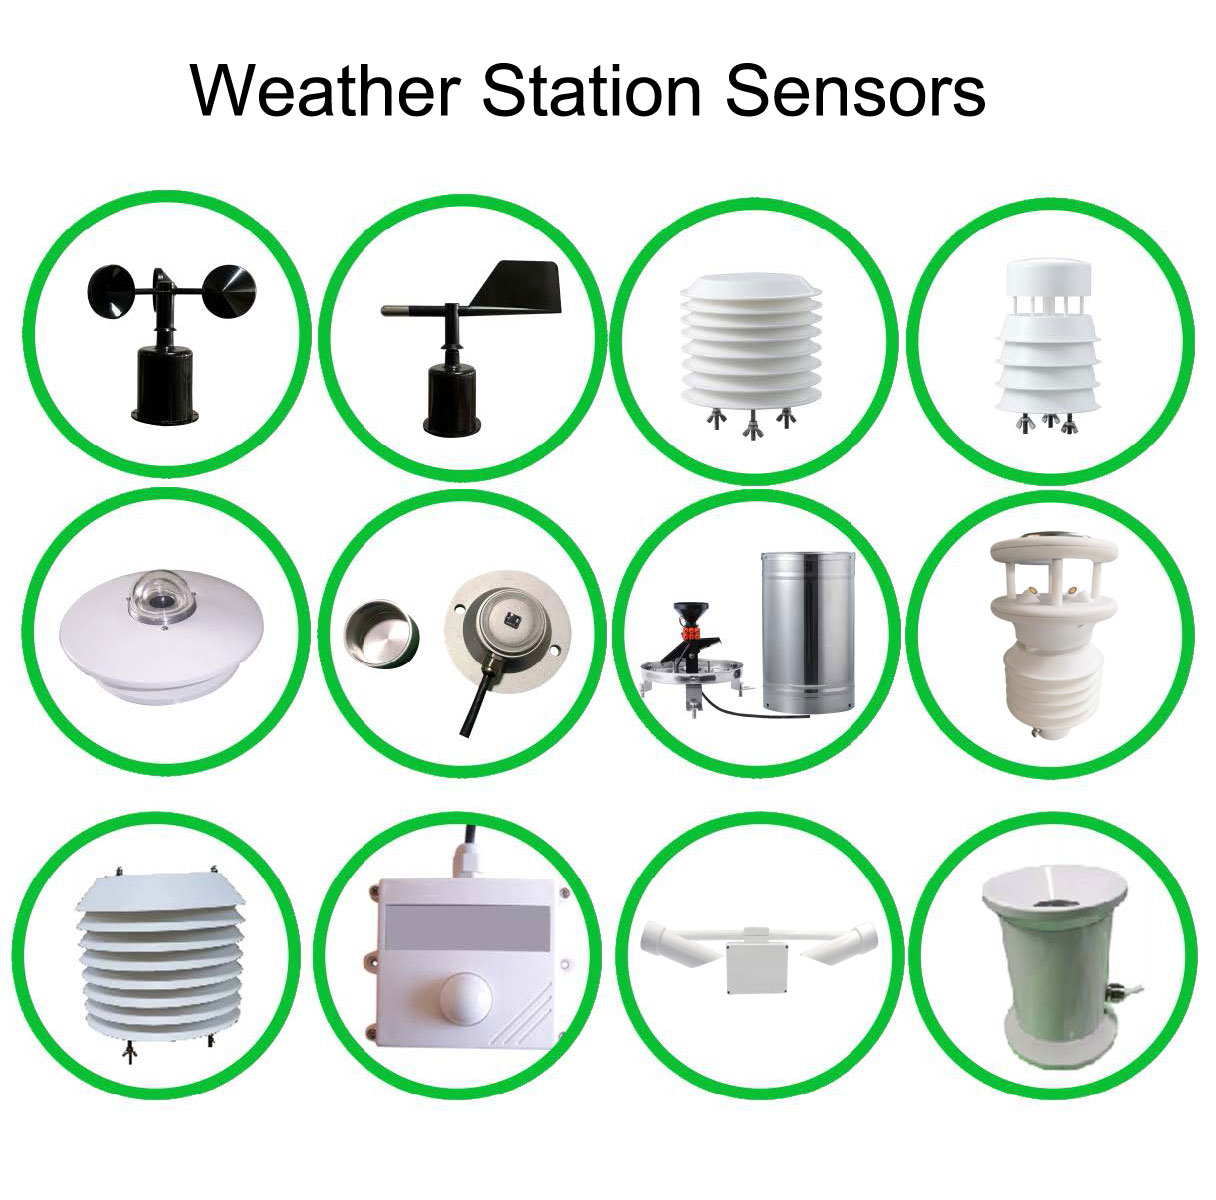
The measurement chain is sensors, data logger, communications service and display application. A compatible logger gathers the sensor data; the display renders only the fields selected for visitors. Staff access to history, maintenance status or configuration does not need to be exposed on the public screen.
The TG462 / TG462S logger provides three RS485 ports and networking functions that can support an appropriate application. Connecting RS485 Modbus RTU sensors still requires register mapping, scaling and serial configuration. Confirm the screen controller's accepted interface as well. A cellular connection does not make a particular LED sign, website or mobile application compatible automatically.
Agree what happens when the station is offline. The display can retain the last observation with a visible time and status, or suppress the measurement until it is current again. Choose the rule before installation. Showing a frozen number as live data is more misleading than showing a clearly unavailable value.
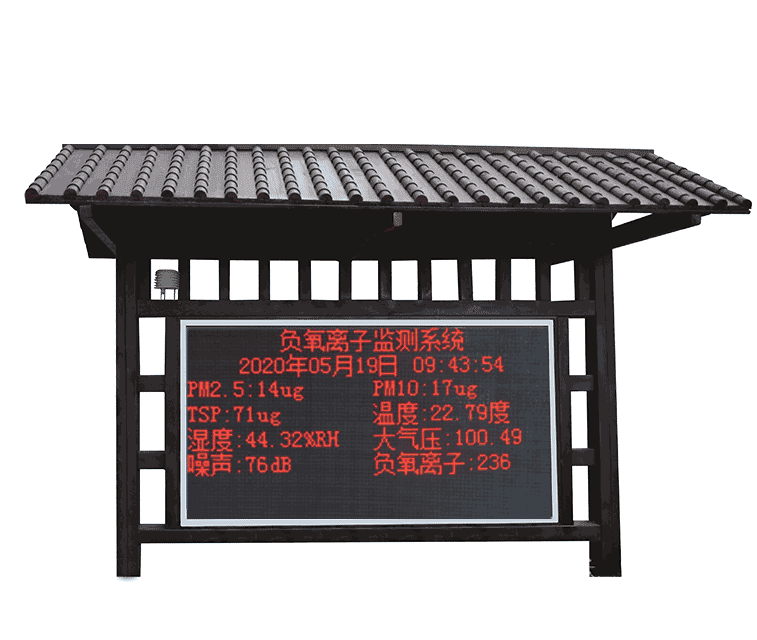
Several errors are easy to avoid during commissioning: labelling total solar radiation as ultraviolet exposure, confusing rainfall accumulation with intensity, or displaying station pressure as an altitude-adjusted value. Check the path from the sensor register to the visitor label, including any calculation performed by the application.
| NiuBoL instrument | Relevant specification | Display or project check |
|---|---|---|
| NBL-W-LBTH | Temperature -40 to 80 C, +/-0.5 C; humidity 0-100% RH, +/-5% RH; pressure 10-1200 hPa, +/-1.5 hPa; DC 12-24 V | Label air temperature, relative humidity and local pressure separately. |
| NBL-W-SS and NBL-W-DS | Wind speed and wind direction; IP65 | Keep speed units, averaging period and direction reference explicit. |
| NBL-W-RS | 0.2 mm resolution; 0-4 mm/min intensity range; operation 0-50 C | Specify the rainfall time window and the start of a new accumulation period. |
| NBL-W-HPRS | Solar irradiance 0-2000 W/m2; spectral range 0.3-3 micrometres | Use W/m2 for irradiance; do not relabel it as UV Index or accumulated energy. |
Accumulated solar energy requires integration over time with a defined interval and treatment of gaps. It is a different displayed quantity from instantaneous irradiance. For ultraviolet information, select a suitable UV instrument and confirm the required output quantity; a broadband pyranometer cannot provide that channel by changing its label.
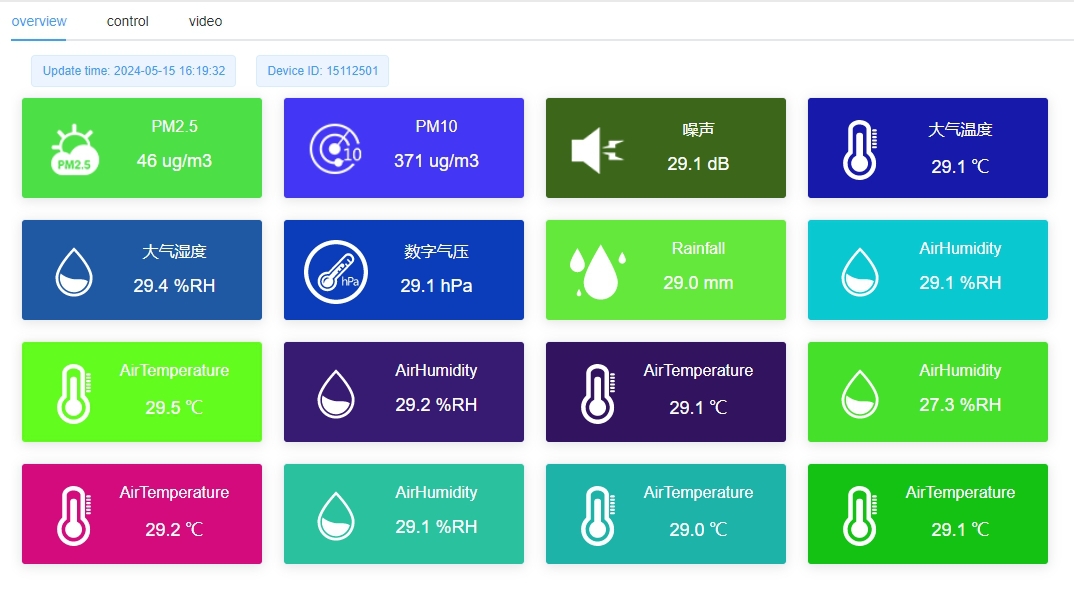
Some scenic-area displays include negative air-ion concentration. Treat it as a defined instrument observation, with its location, measurement conditions and maintenance requirements. It does not establish therapeutic benefit or replace particulate and gaseous-pollutant measurements. Avoid a composite label such as clean-air score unless its method and intended meaning are established.
Weather data can support staff decisions without claiming to prevent every hazard. Trail closures, flood response and exposed-platform restrictions need site-specific procedures, authorized staff and other relevant information. A rainfall channel cannot determine the stability of a slope; a calm reading under trees cannot authorize operation of exposed equipment elsewhere.
The public screen can be prominent while the sensors occupy a more representative, serviceable position. Keep the air shield away from warm walls and exhaust, the rain collector clear of tree drip, and wind instruments away from canopy shelter where open exposure is required. Install solar-radiation sensors with the required sky view and a means to inspect their surfaces.
Budget power separately for the sensors, logger, communications and display. A visitor screen can change the load substantially; a low-consumption sensor does not establish whole-system autonomy. Ask for a configuration-specific quotation covering the enclosure, display interface, installation work and any recurring communications or software service rather than assuming fixed cost percentages.
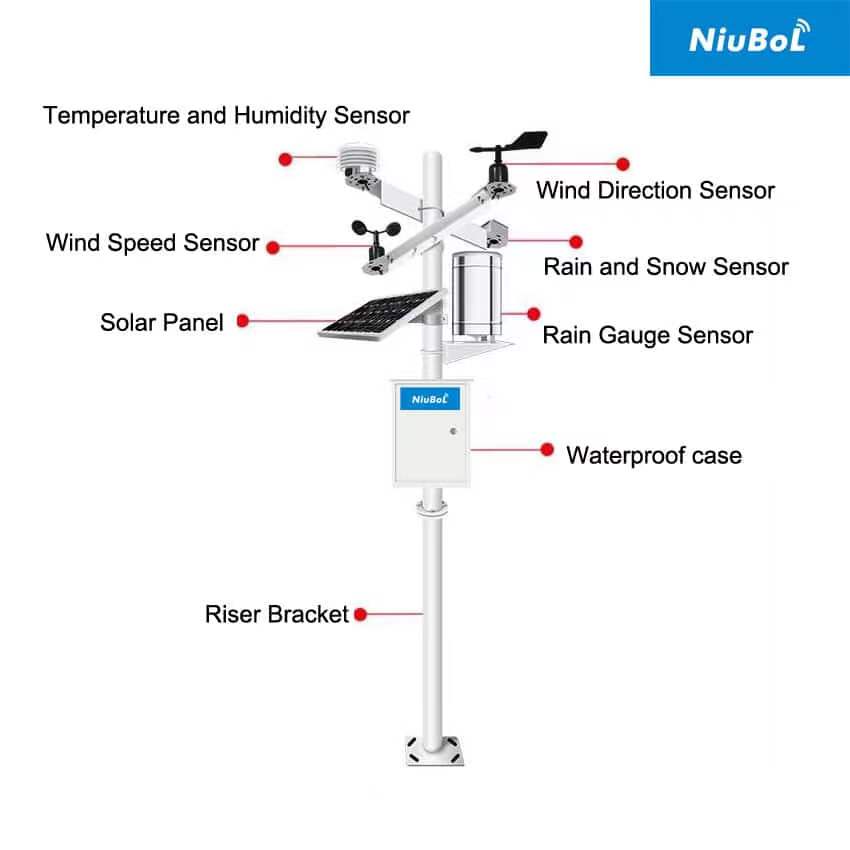
Only if its location represents the information being presented. A large attraction with valleys, open water and elevated viewpoints can have distinct conditions. Identify the zones staff actually manage and label each observation by location; add points where the operational need justifies them.
No. Display the values visitors can interpret correctly and retain technical channels for staff where appropriate. A station may collect pressure or diagnostic information without adding it to an entrance sign. Keep public labels concise and retain units and observation time.
Not from broadband irradiance alone. The NBL-W-HPRS measures solar irradiance over its specified band, not UV Index. A UV-information service needs the appropriate measurement and interpretation, rather than a conversion assumed from total radiation.
Check every displayed value against the logger, then verify units, sensor location, rainfall reset time and the treatment of stale or missing data. Disconnect one test channel under controlled conditions and confirm that an unavailable value is not displayed as zero or as current weather.
Provide a site plan, required observations, screen location and language, power availability, network coverage and the existing management platform's interface. Identify whether the project needs only local display, a staff archive or both. These choices determine the instruments, acquisition software and display integration.
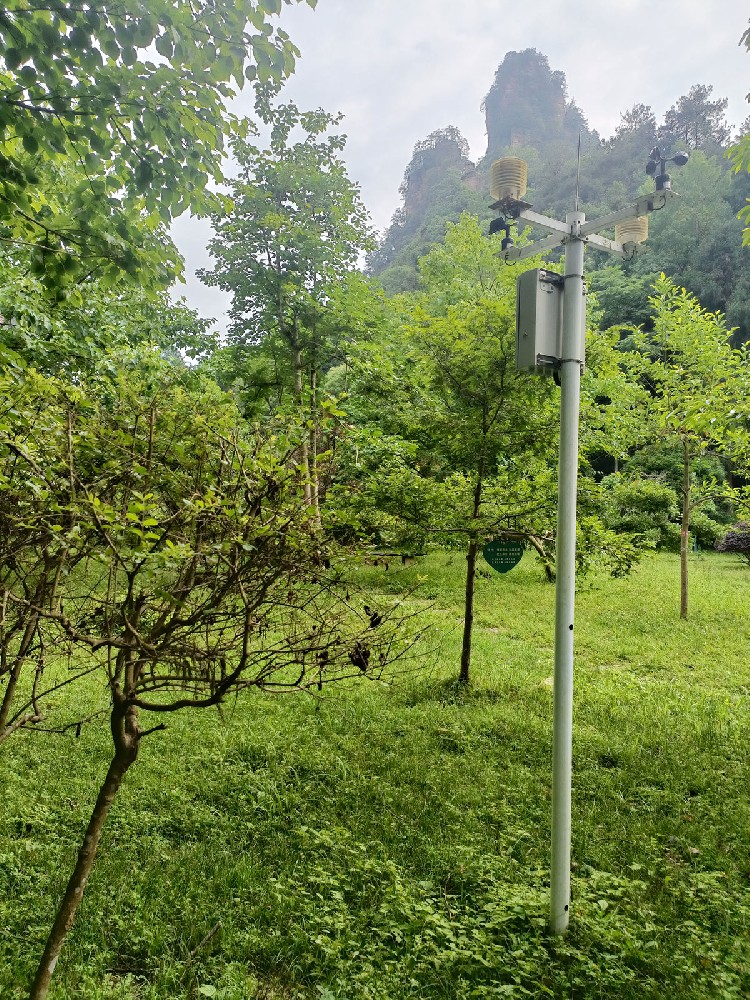
A tourist attraction weather station provides more useful information when measurement location, displayed quantity and operating purpose remain clear. NiuBoL can combine meteorological sensors with compatible acquisition equipment for local observation and display projects. A site plan and a proposed display schedule are practical starting points for selecting the configuration.
Prev:Agricultural Weather Station Data Validation: Check Decisions Against Field Records
Next:Highway Weather Monitoring Station: Choose Channels by Road Section
Related recommendations
Sensors & Weather Stations Catalog
 Agriculture Sensors and Weather Stations Catalog-NiuBoL.pdf
Weather Stations Catalog-NiuBoL.pdf
Agriculture Sensors Catalog-NiuBoL.pdf
Water Quality Sensor Catalog-NiuBoL.pdf
Related products
 Combined air temperature and relative humidity sensor
 TDR Soil Moisture & Temperature Sensor for irrigation| RS485 |4-20mA| NBL-S-THR
 Soil pH sensor RS485 soil Testing instrument soil ph meter for agriculture |NBL-S-PH
 Wind Speed sensor Output Modbus/RS485/Analog/0-5V/4-20mA
 Tipping bucket rain gauge for weather monitoring auto rainfall sensor RS485/Outdoor/stainless steel
 Pyranometer Solar Radiation Sensor 4-20mA/RS485


Screenshot, WhatsApp to identify the QR code
WhatsApp number:+8615367865107
(Click on WhatsApp to copy and add friends)

