





— Blogs —
—Products—
 Consumer hotline +8618073152920
WhatsApp:+8615367865107
Address:Room 102, District D, Houhu Industrial Park, Yuelu District, Changsha City, Hunan Province, China
Product knowledge
Time:2025-04-03 13:58:58 Popularity:1938
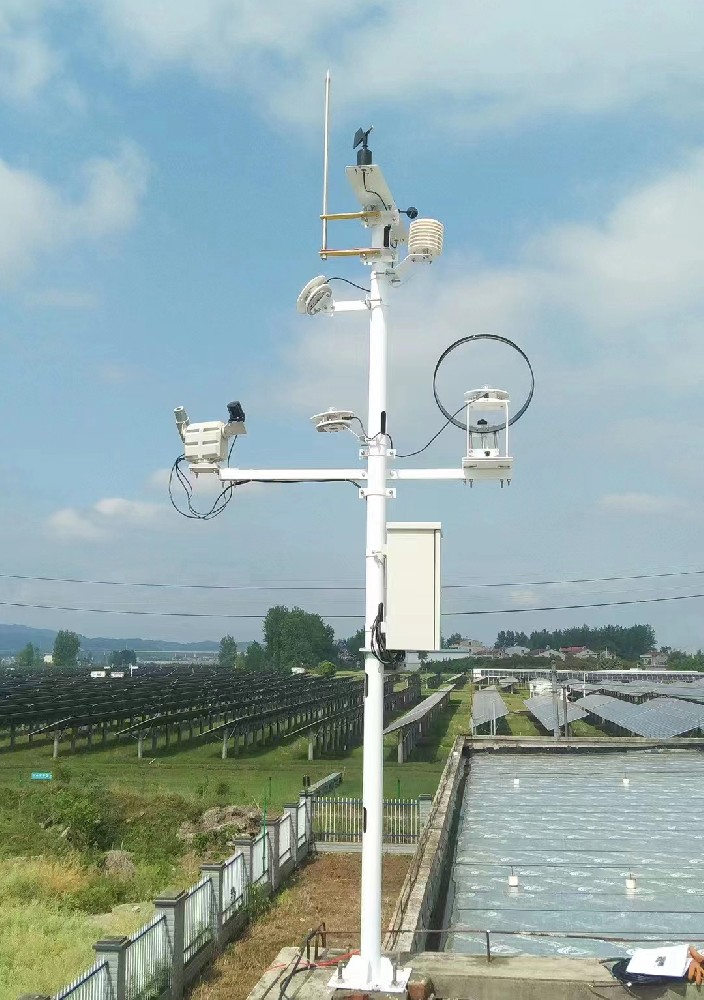
A PV weather station for power forecasting supplies local observations, not a complete forecast by itself. Useful inputs can include irradiance, air and module temperature, wind and time-aligned plant power records. Forecast horizon, external weather inputs and the prediction method must be specified separately. Buying weather sensors does not automatically include a forecasting service, solar tracking or an improvement in forecast accuracy.

A prediction for the next operating interval differs from a day-ahead production schedule. State the forecast issue time, target period, time step and output quantity before choosing the measurement package. Instantaneous power in kW and energy accumulated over an interval in kWh are not the same target.
Also define the plant boundary. AC power at an inverter, total inverter output and export at a grid connection can differ. A model trained on one quantity cannot be evaluated against another without accounting for that difference. Keep any capacity used for normalization identified as AC, DC or another agreed reference.
Local observations can describe recent conditions and support model development or verification. Longer-ahead forecasts may require external weather information. National-laboratory solar forecasting work treats forecasting as an analytical capability beyond routine sensor acquisition. The sensor quotation and forecast-service scope should remain distinct.
| Input | Why it can matter | Definition needed |
|---|---|---|
| Irradiance | Describes the solar resource at the measurement plane | GHI or plane-of-array quantity, orientation, units and averaging period |
| Air temperature | Environmental input for thermal or statistical relationships | Shielded air measurement at a documented location |
| Module temperature | Describes a monitored module's thermal condition | Probe position, mounting and distinction from cell temperature |
| Wind | Provides local airflow context | Exposure, selected statistic and whether direction is also measured |
| Plant power and operating state | Defines the forecast target and explains non-weather changes | Meter boundary, curtailment, outages and equipment availability |
| External weather forecast | Provides predicted conditions beyond the local observation time | Provider, issue time, lead time and available variables |
Not every forecasting method needs every listed input. Agree the required variables with the team providing the forecast, then select the instruments. Humidity and pressure may be useful where the chosen method uses them, but adding them alone does not establish better predictions.
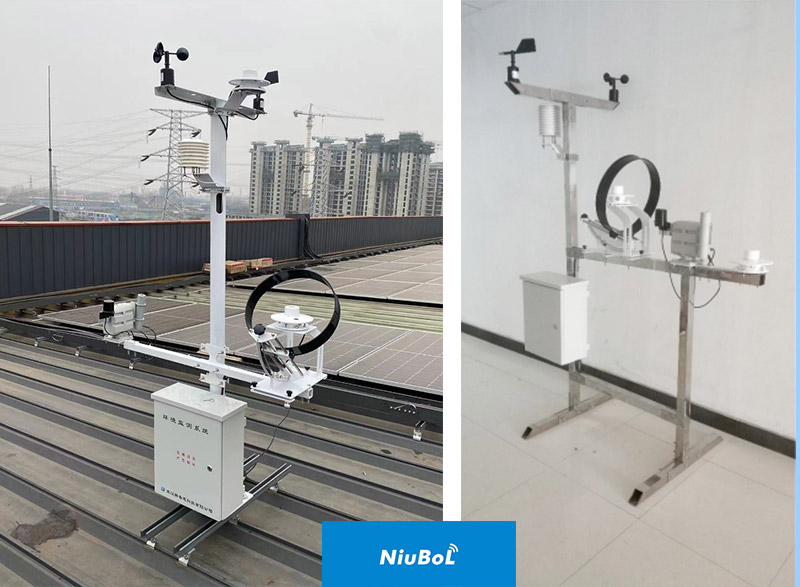
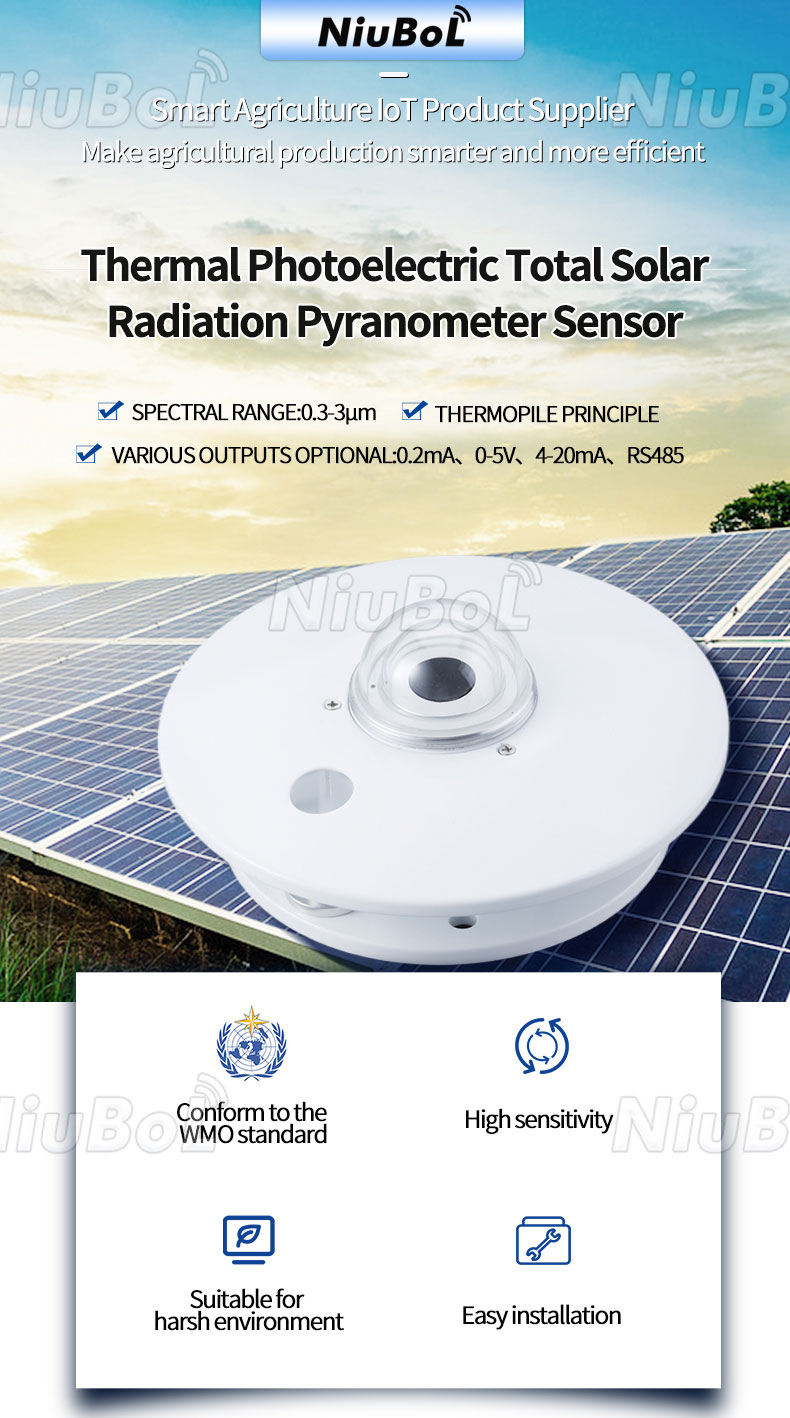
The NiuBoL NBL-W-HPRS thermopile pyranometer measures irradiance on its exposed sensing plane. A horizontally mounted head and a head mounted parallel to a tilted array do not report the same quantity. Record the mounting plane with the channel definition rather than labeling both simply solar radiation.
A single ordinary pyranometer does not independently supply GHI, direct normal irradiance and diffuse horizontal irradiance at once. Those quantities require appropriate measurement arrangements. Likewise, a radiation-instrument tracker is different from a system controlling the photovoltaic array. Neither is an automatic inclusion in every weather station.
| Example NiuBoL component | Selected specification | Forecast-data implication |
|---|---|---|
| NBL-W-HPRS | 0-2000 W/m²; spectral range 0.3-3 µm; response ≤35 seconds to 99% | Do not interpret frequent polling as instantaneous physical response. |
| NBL-W-LBTH | Air temperature -40°C to 80°C, ±0.5°C; humidity 0-100%RH, ±5%RH; DC 12-24 V | Air conditions are separate from module and cell temperatures. |
| NBL-W-PPT | Temperature measurement -50°C to 100°C; stated accuracy ±0.5°C; selected RS485 or analog version | Define the contact position and output conversion; do not apply a universal module power-loss coefficient. |
| NBL-W-SS | 0-45 m/s or 0-70 m/s version; IP65 | Select the range and observation statistic the forecasting workflow actually needs. |
These are individual component values, not a combined prediction accuracy. The HPRS can be ordered with different outputs; match the actual signal and scaling to the logger. Its sensitivity or transmitter conversion belongs to the instrument configuration, not to the forecast algorithm.
A forecast must use information available when it was issued. Using the measured irradiance from the future target interval as though it were known at issue time produces a retrospective calculation, not an operational forecast. Keep forecast issue time, target time and observation time as distinct fields.
Use the acquisition timestamp for weather observations and retain server receipt time where delivery delay matters. An observation received after a forecast deadline may still be useful for later verification, but it was not available to that forecast. Preserve that distinction when preparing evaluation files.
Match the weather and power intervals. A five-minute irradiance average and a single power sample at the end of that interval are different summaries. Agree the intended combination, including interval boundaries and time zone. A shared timestamp format does not guarantee that the values describe the same period.
Clouds are not the only reason plant output falls. Curtailment, inverter downtime, export limits, maintenance and shading changes can alter the relationship between weather and power. Retain the available operating-state information so the forecast provider can apply a defined treatment instead of silently treating every low value as a weather effect.
Keep missing observations identifiable. Filling an unavailable irradiance interval with zero makes a data fault resemble darkness or heavy shading. Interpolation and other reconstruction may be appropriate for a specified analysis, but must remain distinguishable from measurements and must not use future information in an operational test.
Sensor accuracy and forecast error answer different questions. To compare forecast results, hold the horizon, target, test period and data rules consistent. Reserve a test period not used to fit the method, and retain the forecast actually issued rather than replacing it after observations arrive.
For an illustrative four-interval test, suppose absolute power errors are 20, 10, 30 and 10 kW. Mean absolute error is (20 + 10 + 30 + 10) / 4 = 17.5 kW. If the agreed normalization is a 1000 kW plant capacity, normalized MAE is 1.75%. These are hypothetical numbers explaining the calculation, not achieved NiuBoL station performance.
The same 17.5 kW error produces a different percentage if normalized by average measured power. State the denominator and whether night, curtailed and missing periods are included. A percentage without those definitions cannot support a meaningful supplier comparison or acceptance target.
First accept the observation chain: correct instruments, exposure, units, timestamps, coverage and transfer to the receiving application. Then evaluate the prediction service against the agreed horizon and error method. A poor forecast can result from data or modelling problems; it cannot automatically be assigned to the pyranometer.
The TG462 / TG462S logger family supports RS485 acquisition and configured network functions. The exact storage, message format and destination still need agreement. RS485 Modbus RTU at the sensor is not a promise that a particular forecasting platform can consume the final data without integration work.
A PV station can be accepted for sound measurements before a forecasting model is proven. The station test should cover irradiance-plane identity, module-temperature point, timestamps, data completeness and recovery from missing inputs. The forecasting test should then define horizon, model owner, future weather source and the electrical output used for evaluation. Combining both into one vague 'accurate forecast' promise makes it impossible to diagnose an error.
For a trial, retain the prediction as it was issued and the inputs available at that moment. When the target period ends, compare it with measured generation and document whether a missing station channel, a weather forecast error or a model assumption was responsible for a poor result. The data logger's job is to preserve trustworthy observations; it cannot retroactively supply the future conditions needed by a forecast.
Not merely because it monitors a solar plant. Specify forecasting software or services, inputs, horizon and acceptance separately from the sensors and logger. Ask which delivered component actually produces the prediction.
That depends on orientation, site variability and the intended model. One head describes its own sensing plane and location. Identify which arrays it represents before assuming one value covers different tilts or tracker positions.
It can support a retrospective study, but cannot be treated as information available before it was measured. Preserve issue and availability times so operational forecast evaluation does not benefit from future observations.
No. The physical sensor response, recording method, data quality, forecast horizon and prediction method all matter. Select the interval required by the workflow and verify that the observations arrive before the relevant deadline.
Provide the forecasting horizon and target, required observations, array orientations, existing plant data interface and receiving format. State whether NiuBoL is supplying the measurement package only or whether additional integration is required. No universal error reduction can be inferred from the equipment list.
Start with the forecasting model's defined inputs and their required time basis. Identify measured irradiance plane, ambient or module temperature, wind and any other requested fields separately. The station should not be sold as a universal forecasting package when the model, horizon and future weather source have not been agreed.
Keep a time-stamped record of the inputs available at the forecast issue time, the issued prediction and the later measured electrical output. Compare like-for-like horizons and intervals; do not feed actual future weather back into an earlier forecast. Document missing inputs and model revisions before drawing conclusions about station value.
They can help when spatial differences across the plant matter and the model can use the additional observations. More hardware does not compensate for incorrect irradiance plane, poor exposure or mismatched timestamps. Ask the forecast team to justify sensor locations from array layout and model validation, then pilot the arrangement before scaling.
A PV weather station for power forecasting is valuable when it supplies defined, timely observations that the forecast workflow can use. Keep irradiance geometry, temperature meaning, plant operating state and information-availability times clear. Accept the measurement chain and forecasting method separately rather than assigning forecast accuracy or array-tracking functions to ordinary sensors.
 NBL-W-SRS-Solar-radiation-sensor-instruction-manual-V4.0.pdf
NBL-W-HPRS-Solar-Radiation-Sensor-Instruction-Manual-V3.0.pdf
Prev:Reservoir Water and Rainfall Monitoring: Level Is Not Stored Volume
Next:Automatic Weather Station Operating Temperature: Check Each Component
Related recommendations
Sensors & Weather Stations Catalog
Agriculture Sensors and Weather Stations Catalog-NiuBoL.pdf
Weather Stations Catalog-NiuBoL.pdf
Agriculture Sensors Catalog-NiuBoL.pdf
Water Quality Sensor Catalog-NiuBoL.pdf
Related products
 Combined air temperature and relative humidity sensor
 TDR Soil Moisture & Temperature Sensor for irrigation| RS485 |4-20mA| NBL-S-THR
 Soil pH sensor RS485 soil Testing instrument soil ph meter for agriculture |NBL-S-PH
 Wind Speed sensor Output Modbus/RS485/Analog/0-5V/4-20mA
 Tipping bucket rain gauge for weather monitoring auto rainfall sensor RS485/Outdoor/stainless steel
 Pyranometer Solar Radiation Sensor 4-20mA/RS485


Screenshot, WhatsApp to identify the QR code
WhatsApp number:+8615367865107
(Click on WhatsApp to copy and add friends)

