

— Blogs —
—Products—
 Consumer hotline +8618073152920
 WhatsApp:+8615367865107
Address:Room 102, District D, Houhu Industrial Park, Yuelu District, Changsha City, Hunan Province, China
Product knowledge
Time:2026-07-20 13:29:11 Popularity:250
A real-time water quality monitoring system is not defined only by online sensors. Real time means that the measured data can reach the operator quickly enough to support a decision. For some parameters, one-minute updates are useful. For others, a longer interval is acceptable if maintenance and data quality are stable.

A river pollution warning station, an aquaculture pond, a wastewater outlet and an RO plant use different alarm logic. The buyer should write down what action follows each alarm: inspection, aeration, dosing adjustment, discharge stop, pump change or record review. Sampling rate should then support that action.
| Parameter | Typical real-time use | Sampling note |
|---|---|---|
| pH | Dosing, process control and discharge alarm | Frequent enough to catch chemical swings. |
| DO | Aeration and aquatic life risk | Short interval useful in aquaculture. |
| Turbidity/TSS | Suspended solids event detection | Trend and maintenance flags matter. |
| Conductivity/TDS | Ion load, RO performance and contamination events | Often stable but important for spikes. |
| COD/ammonia | Pollution and wastewater risk | Sampling interval depends on sensor principle and response goal. |
| Parameter | Verified specification or buyer note |
|---|---|
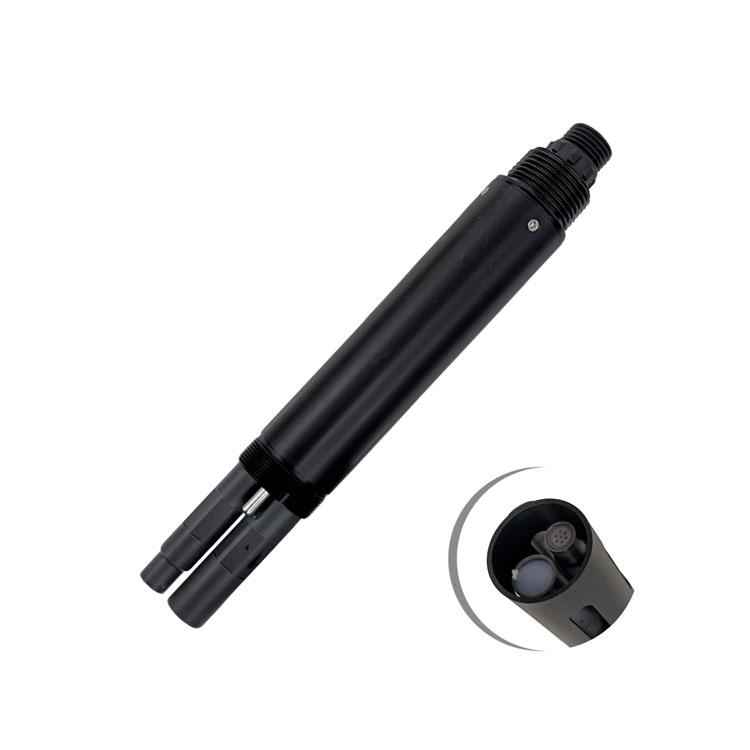
| Model | NBL-WQ-MPS-5A / multi-parameter package |
| DO | 0 to 20 mg/L, ±2%, 0.01 mg/L |
| Turbidity | 0 to 100 NTU or 0 to 1000 NTU, 0.1 NTU |
| Conductivity/salinity | 0 to 5000 µS/cm, 0 to 200 mS/cm, 0 to 70 PSU |
| pH | 0 to 14 pH, ±0.1 pH, 0.01 pH |
| ORP | -1500 mV to +1500 mV, ±6 mV |
| COD option | 0 to 200 or 0 to 500 mg/L equivalent KHP |
| Use case | Buoy, river, aquaculture and station packages where cleaning and fewer cables matter |
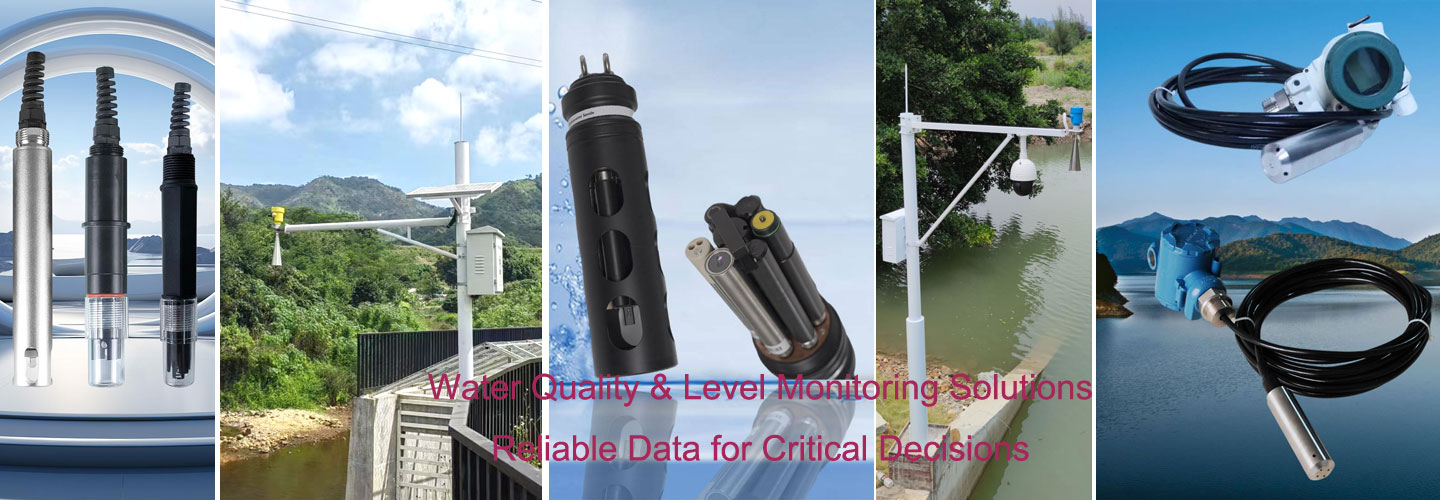
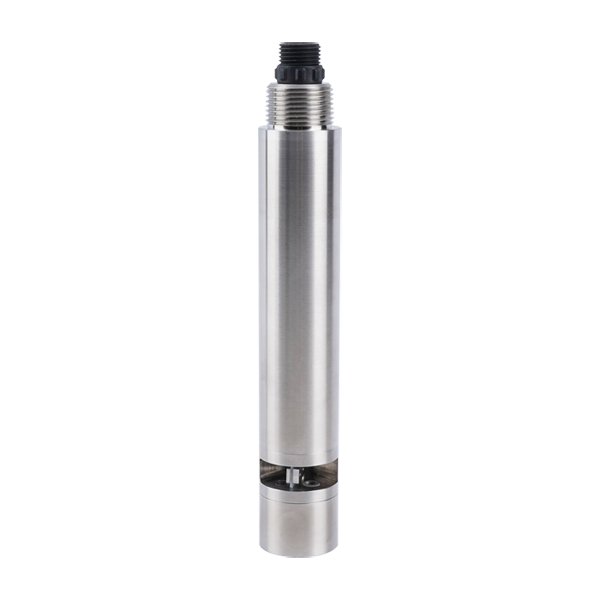
NiuBoL single-parameter and multiparameter sensors can be combined into a monitoring station. RS485 Modbus RTU allows several digital sensors to connect to a data logger or gateway when bus length, address planning, grounding and power design are handled correctly.
Do not use only one alarm threshold. A good system separates warning, emergency alarm, maintenance alarm and communication alarm. Warning values guide operators before the process becomes unsafe. Emergency alarms trigger immediate response. Maintenance alarms prevent dirty sensors from creating false process alarms.
Real-time data must be trusted. Project acceptance should check calibration status, missing data, sensor cleaning events, communication loss and time synchronization. If the platform cannot show maintenance periods, later users may treat bad data as a real pollution event.
A station may include sensors, controller, power supply, solar or AC power, battery, cabinet, lightning protection, 4G gateway and cloud platform. Remote sites need clear responsibility for SIM card, platform account, spare parts and field maintenance. Urban stations may integrate with SCADA or municipal platforms.
For an RFQ, send water type, expected concentration range, temperature, pressure, installation method, cable length, output preference, quantity and destination country. For real-time water quality monitoring system, include whether the point is for spot checking, closed-loop control, alarm evidence or long-term trend records.
For contractor projects, also define who supplies the cabinet, controller, sampling line, power supply, lightning protection, civil work and communication card. Clear supply boundaries prevent delays during commissioning and make quotations easier to compare.
A real-time system should define who receives the alarm, what they check first and how the event is closed. Without a response workflow, a platform becomes a display screen rather than a management tool. For example, a turbidity spike may require checking rainfall, upstream discharge and sensor window fouling before the operator decides whether it is a pollution event.
For aquaculture, a low DO alarm may trigger aeration immediately, but an ammonia warning may trigger feeding adjustment and additional testing. For wastewater, a pH alarm may stop discharge or alert the neutralization system. These actions should be documented before thresholds are entered into the platform.
| Alarm type | Purpose | Example action |
|---|---|---|
| Warning | Early attention before risk becomes high risk | Inspect trend and prepare response. |
| Emergency | Immediate operating action | Start aeration, stop discharge or check dosing. |
| Maintenance | Sensor or sampling issue | Clean probe, verify flow or calibrate. |
| Communication | Data pathway failure | Check power, gateway, SIM card or cable. |
A river station may combine pH, DO, conductivity, turbidity, COD and ammonia nitrogen. An aquaculture station may focus on DO, pH, temperature, ammonia nitrogen and salinity when relevant. A water treatment station may use pH, residual chlorine, conductivity and turbidity. A real-time system should not copy another site without checking the decision purpose.
For multi-site projects, keep parameter names and units consistent. If one station reports TDS and another reports conductivity, managers may compare values incorrectly. Standardizing units and tag names reduces mistakes.
After installation, review data for at least several operating cycles before treating every threshold as final. Look for missing data, flatlines, impossible spikes and maintenance periods. These checks reveal whether the system is measuring water quality or mostly measuring installation problems.
A good supplier discussion includes sensor model, communication method, platform functions and maintenance workflow. NiuBoL can support the sensor and monitoring package selection when the response goal is clear.
Real-time systems can produce more data than operators can use. The platform should show current values, trend curves, alarm history and maintenance records in a way that supports decisions. If every small fluctuation creates an alarm, operators will start ignoring the system. Good thresholds require process knowledge and early data review.
Data interval should also match communication cost and power budget. A solar station with 4G upload may not need second-level data for every parameter. A plant PLC may need faster polling for pH control. The same sensor package can therefore be configured differently in different projects.
| Project type | Data interval logic | Platform focus |
|---|---|---|
| Aquaculture alarm | Short interval for DO and pH | Operator notification and trend. |
| River station | Moderate interval with event alarm | Pollution trend and missing data. |
| Industrial process | Fast enough for control action | SCADA tags and alarm response. |
| Research monitoring | Consistent interval and export | Data completeness and metadata. |
If a probe is cleaned or calibrated, that event should be recorded. Otherwise a sudden value change may look like a water event. For long-term monitoring, maintenance records are part of data quality. Buyers should ask whether the platform can mark service periods or whether the owner must keep a separate log.
The first month should be used to tune thresholds, confirm sensor cleaning intervals and remove alarms that do not lead to action. If the system creates too many messages, operators stop trusting it. If thresholds are too loose, the system misses the event it was purchased to catch. A review meeting after early operation is a practical way to protect the investment.
For multi-site monitoring, compare missing data rate, alarm count and maintenance count by station. A station with many alarms may have a real water problem, but it may also have poor installation, weak communication or sensor fouling. Reviewing these indicators prevents wrong conclusions.
| Review metric | What it tells the owner |
|---|---|
| Missing data rate | Power, communication or platform reliability. |
| Alarm count | Water risk or threshold design quality. |
| Maintenance count | Sensor fouling and service workload. |
| Response time | Whether the monitoring workflow works. |
Before release, write a one-page response matrix. It should list each parameter, warning threshold, emergency threshold, responsible person and first action. This document makes the system operational. Without it, sensors may upload data continuously while no one knows what action should follow an alarm.
Also define data retention and export requirements. Environmental projects often need historical reports, while process projects may need SCADA tags and trend charts. If the platform requirement is not stated early, the buyer may receive sensors that work technically but do not satisfy reporting needs.
For a river event monitoring station, pH, conductivity, turbidity, DO, COD and ammonia nitrogen may be used together. A conductivity spike may show an inflow event, turbidity may show runoff, DO may show ecological stress and ammonia nitrogen may point toward sewage or agricultural impact. The system value comes from reading these signals together.
The alarm should therefore avoid treating every parameter independently. A combined alarm rule can flag events where several indicators move at the same time, while maintenance alarms should identify dirty probes or missing communication separately.
For final review, keep one document that lists the measured parameter, normal operating range, alarm range, installation point, output signal, maintenance owner and reference check method. This small document helps purchasing, engineering and site operators judge the same project with the same assumptions.
A: Data are real time when the sensor, logger and platform deliver values quickly enough for the required site response.
A: Choose parameters by risk: pH, DO, turbidity, conductivity, COD, ammonia nitrogen, residual chlorine or salinity depending on the site.
A: No. Very fast sampling can create noise, power load and data clutter. Rate should match the action required.
A: Use warning, emergency, maintenance and communication alarms separately so operators know whether to inspect water, clean a sensor or check the network.
A: Yes. RS485 Modbus RTU is common for water quality sensors connected to data loggers, PLCs, RTUs or IoT gateways.
A: Dirty probes, bubbles, bad sampling points, calibration drift, power loss, communication failure and wrong thresholds are common causes.
A: Use it when several parameters are needed at one point and the site benefits from fewer cables and easier maintenance.
A: Check sensor readings, communication, historical storage, alarm rules, missing data handling and maintenance records.
A: Provide site purpose, parameter list, point count, power condition, communication method, alarm action and installation photos.
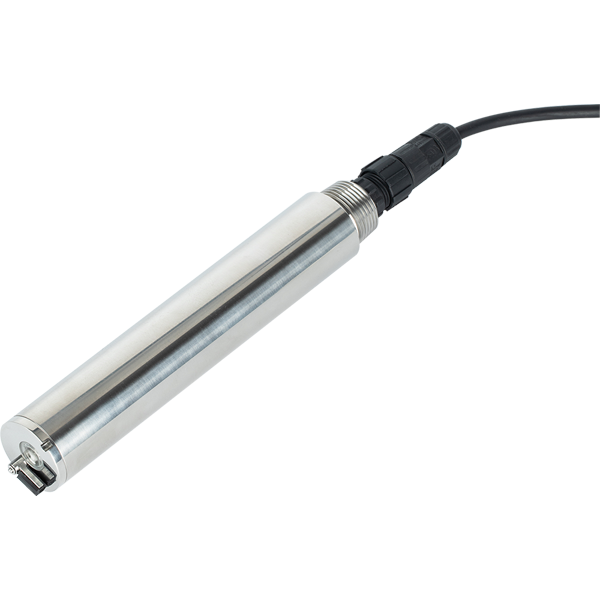
Real-time water quality monitoring is a system design task. The buyer must define parameter purpose, sampling interval, alarm response and maintenance controls before selecting sensors. NiuBoL can support single-parameter and multiparameter monitoring packages with RS485 Modbus RTU, data collection and project integration guidance.
 NBL-WQ-CL Water Quality Sensor Online Residual Chlorine Sensor.pdf
NBL-WQ-DO Online Fluorescence Dissolved Oxygen Sensor.pdf
NBL-WQ-NHN Ammonia Nitrogen Water Quality Sensor.pdf
NBL-WQ-COD Online Water Quality COD Sensor.pdf
NBL-WQ-PH Online pH Water Quality Sensor.pdf
NBL-WQ-EC water quality conductivity sensor.pdf
Prev:Water Quality Analyzer Price: Single-Parameter vs Multiparameter Cost
Next:Water Quality Monitoring Sensor Integration with PLC, SCADA and IoT Gateways
Related recommendations
Sensors & Weather Stations Catalog
Agriculture Sensors and Weather Stations Catalog-NiuBoL.pdf
Weather Stations Catalog-NiuBoL.pdf
Agriculture Sensors Catalog-NiuBoL.pdf
Water Quality Sensor Catalog-NiuBoL.pdf
Related products
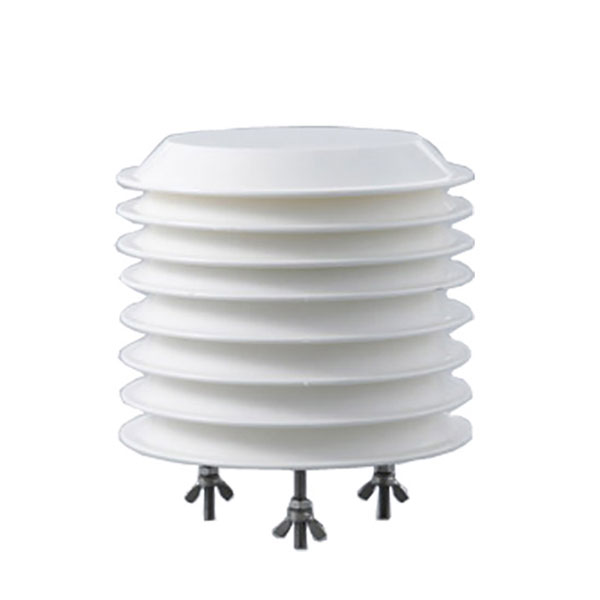 Combined air temperature and relative humidity sensor
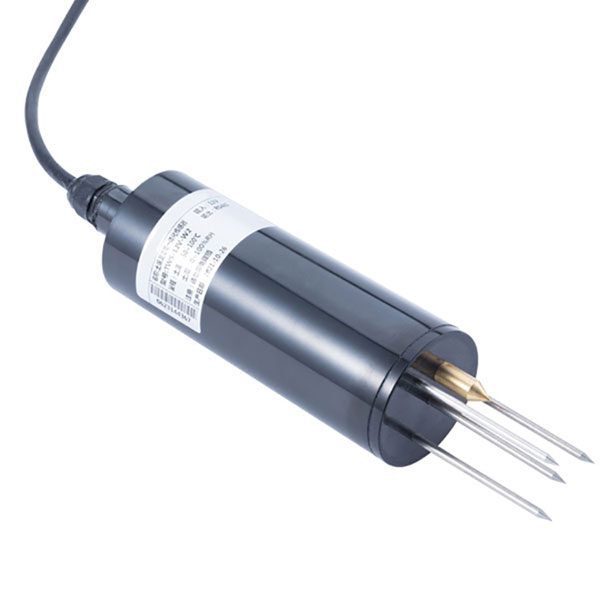 TDR Soil Moisture & Temperature Sensor for irrigation| RS485 |4-20mA| NBL-S-THR
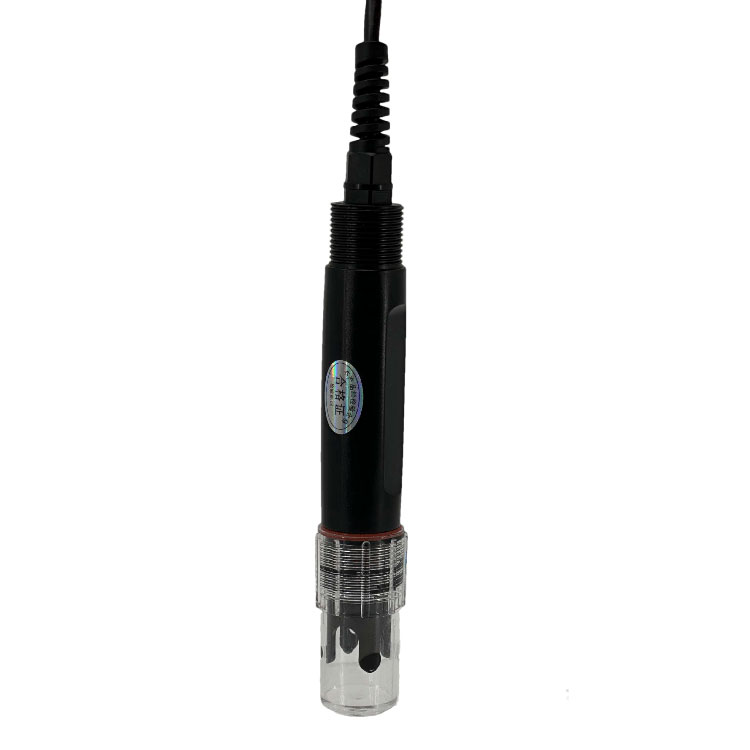 Soil pH sensor RS485 soil Testing instrument soil ph meter for agriculture |NBL-S-PH
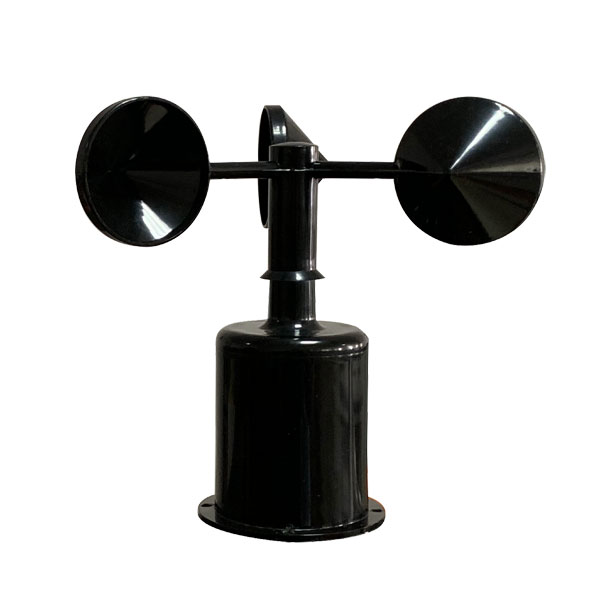 Wind Speed sensor Output Modbus/RS485/Analog/0-5V/4-20mA
 Tipping bucket rain gauge for weather monitoring auto rainfall sensor RS485/Outdoor/stainless steel
 Pyranometer Solar Radiation Sensor 4-20mA/RS485

Screenshot, WhatsApp to identify the QR code
WhatsApp number:+8615367865107
(Click on WhatsApp to copy and add friends)