

— Blogs —
—Products—
 Consumer hotline +8618073152920
 WhatsApp:+8615367865107
Address:Room 102, District D, Houhu Industrial Park, Yuelu District, Changsha City, Hunan Province, China
Product knowledge
Time:2026-07-21 13:44:58 Popularity:228
A turbidity sensor is usually bought when the project needs to see suspended particles continuously. The problem may be filter breakthrough in a water plant, storm runoff in a river, solids carryover in wastewater or algae and sediment changes in a reservoir. The buyer should first define the expected NTU range and the action that follows an alarm.
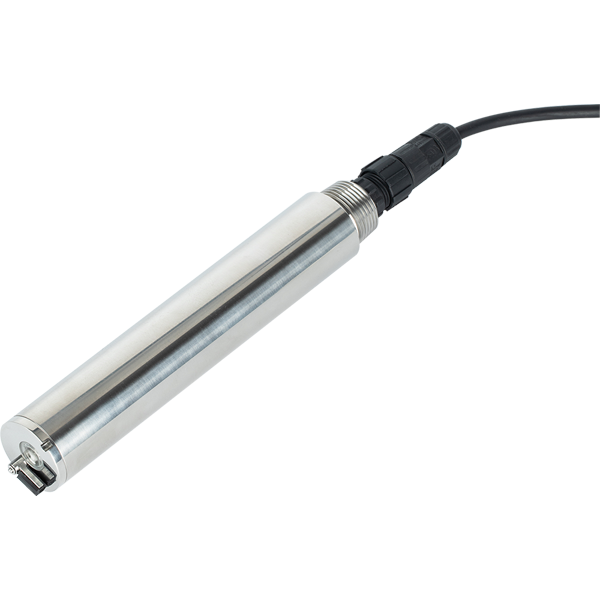
Range is important, but the optical window, cleaning access, water movement and installation angle decide whether the sensor remains useful. Low-range drinking water monitoring needs stable optics and careful installation. River or wastewater monitoring needs stronger fouling control and a plan for sediment, bubbles and floating debris.
| Parameter | Verified value or procurement note |
|---|---|
| Model | NBL-WQ-TS / NBL-WQ-TS-4 series |
| Method | Scattered light turbidity measurement |
| Range options | 0 to 20.00 NTU, 0 to 100.0 NTU, or 0 to 1000.0 NTU |
| Resolution | 0.01 NTU or 0.1 NTU by range; 0.1°C temperature |
| Accuracy | ±3% or ±1.5 NTU; ±3% or ±2 NTU; ±5% or ±3 NTU by range |
| Temperature compensation | Automatic, Pt1000 |
| Power and output | 12 to 24 VDC; RS485 Modbus RTU |
| Installation and protection | 3/4 NPT immersion mounting; 5 m cable customizable; IP68 |
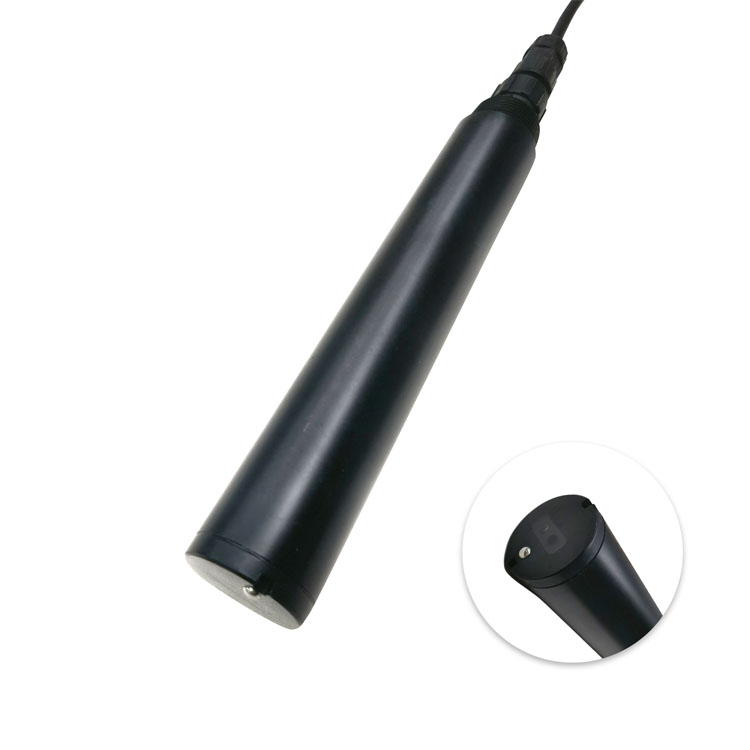
The verified turbidity ranges include 0 to 20.00 NTU, 0 to 100.0 NTU and 0 to 1000.0 NTU. Buyers should avoid ordering the widest range by default. A low-range application needs better sensitivity at low NTU, while a dirty river or wastewater point needs enough headroom to handle events without saturating the reading.
| Application | Useful range logic | Installation concern |
|---|---|---|
| Drinking water outlet | Low NTU range and stable trend | Avoid bubbles and pipe turbulence. |
| River monitoring | Medium to high range depending on flood events | Protect the optical window from sediment and debris. |
| Wastewater discharge | Higher range and easy cleaning access | Check sludge, grease and sample representativeness. |
| Reservoir or lake | Trend monitoring across seasons | Biofilm and algae may affect the window. |
A turbidity sensor can connect by RS485 Modbus RTU to a data logger, PLC or IoT gateway. In a river station, turbidity is often combined with pH, DO, conductivity, COD or ammonia nitrogen. In a treatment plant, it may be connected to SCADA for filter performance and alarm records.
Optical turbidity measurement depends on a clean measurement window. If the site is remote, include a cleaning method, safe access and a maintenance log. If the reading is used for compliance or operation, keep a portable turbidity check or laboratory reference procedure so the online value can be verified after cleaning or heavy events.
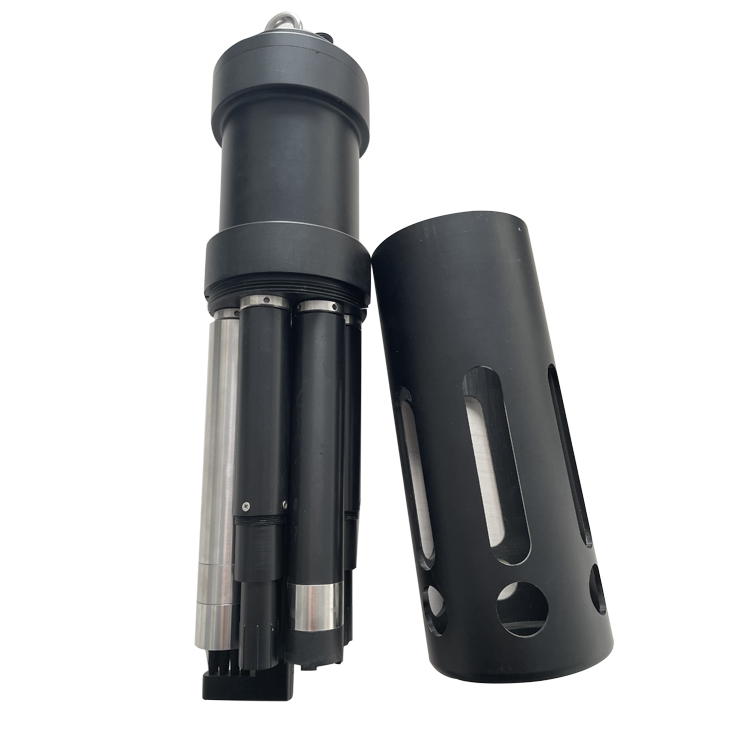
For a turbidity sensor, send the water type, expected range, temperature, pressure, installation photos, cable length, output requirement, controller or gateway model, quantity and destination country. Include normal NTU range, maximum event range, water depth, solids type, cleaning access and whether the point is open-channel, tank, pipe or station mounted.
For contractors, also state who supplies the cabinet, bracket, sampling line, power supply, surge protection, SIM card or platform account. Missing scope items usually appear during commissioning, when they are more expensive to solve.
A common mistake is treating turbidity and TSS as the same purchase. Turbidity is normally reported in NTU and responds to light scattering. TSS is a mass concentration and depends on local particle characteristics. If the project needs suspended solids in mg/L, discuss TSS calibration and application conditions instead of assuming NTU can be converted directly.
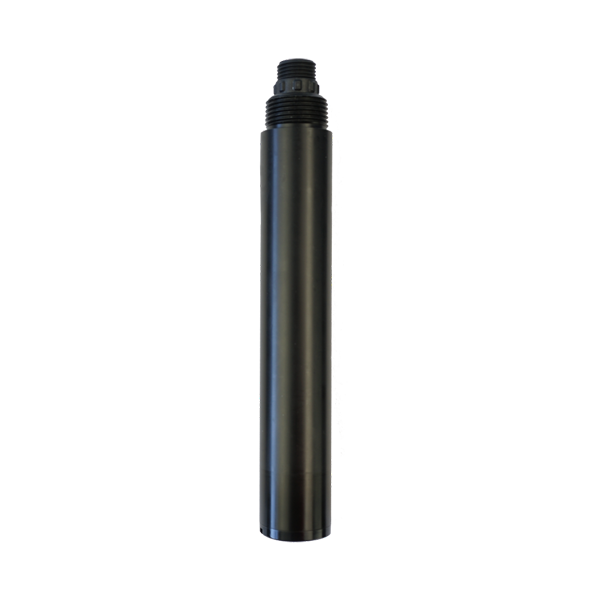
A turbidity sensor should be placed where the water is mixed and representative. In a pipe, avoid strong bubbles and turbulence. In an open channel, avoid dead corners and places where sediment buries the optical window. In a river, protect the sensor from debris while still keeping it in flowing water.
For low-range clean water, even small bubbles or window deposits can matter. For wastewater or storm runoff, the bigger problem may be rapid fouling and whether operators can clean the sensor safely after a high-solids event.
| Expected condition | Range direction | Reason |
|---|---|---|
| Filtered water | Low range such as 0 to 20 NTU | Better focus on small changes. |
| General surface water | Medium range such as 0 to 100 NTU | Covers normal seasonal variation. |
| Storm or wastewater events | High range such as 0 to 1000 NTU | Avoids saturation during solids spikes. |
| Unknown project | Pilot or sample history first | Prevents wrong range selection. |
Turbidity data should be linked to action. A drinking water plant may inspect filtration or coagulant condition. A river station may mark storm events or construction runoff. A wastewater outlet may trigger sampling or process inspection. If no action is defined, a turbidity graph becomes background noise.
Integrators should confirm RS485 address, register map, cable route, power supply and whether the platform displays NTU with the correct decimal. They should also confirm whether the customer expects turbidity only or wants a TSS estimate. If the tender asks for suspended solids in mg/L, the supplier should discuss a TSS sensor or site correlation instead of only offering NTU.
For NiuBoL projects, the quotation should separate the sensor, controller or logger, mounting bracket, cleaning accessories and any platform requirement. This makes bids easier to compare and reduces field additions.
The first month of turbidity data should be reviewed against rain, filter operation, discharge schedule, cleaning records and known site events. This review helps define realistic warning thresholds. Without a review period, a project may set alarms too tight and create noise, or too loose and miss important events.
For a drinking water or industrial treatment point, turbidity trend can guide filter inspection and process adjustment. For a river station, turbidity may need to be interpreted with rainfall, conductivity and upstream construction activity.
The buyer should ask whether the quotation includes only the probe or also the controller, bracket, cable, data logger, cleaning accessory and platform connection. Optical sensors installed in difficult water need a practical cleaning arrangement. If this is missing from the scope, the installed system may work only during the first clean period.
NiuBoL selection support is strongest when the buyer provides photos of the planned location, expected NTU range and the reason for monitoring. That information changes the recommended range and installation method.
For a filter outlet, the turbidity sensor usually needs a lower NTU range and stable sampling condition. A high-range sensor may survive dirty events, but it may not give the sensitivity the operator expects at low turbidity. The buyer should define normal value, alarm value and maximum event value before range selection.
The contractor should also plan how to remove bubbles from the sample and how to clean the optical window. If bubbles appear after a pump or valve, the turbidity trend may look worse than the actual filtered water.
Before releasing the purchase order, the buyer should confirm five items in writing: measured parameter, expected range, installation point, output signal and maintenance owner. These five items prevent most misunderstandings between purchasing, engineering, site operators and the supplier. If any item is unknown, the RFQ should say so clearly instead of hiding the uncertainty.
The quotation should also separate sensor body, cable, controller or data logger, mounting accessory, calibration or verification materials, communication gateway, packing and documents. This makes it possible to compare suppliers by actual scope. A lower price is not useful if the buyer later discovers that the controller, flow cell, bracket or register map was not included.
Keep the user manual, wiring definition, Modbus register map, calibration record, installation photos, alarm settings, packing list and spare-part suggestion in one folder. For distributors and contractors, this file is also after-sales protection. When the end user asks for help months later, the service team can see what was supplied, how it was installed and what assumptions were used during commissioning.
For tenders, clarify whether the required output is raw turbidity, event alarm, long-term trend or compliance evidence. These are different deliverables. A sensor that is acceptable for trend monitoring may still need a reference method if the owner must report official values to an external authority or project supervisor.
For turbidity projects, the final check should compare normal NTU, alarm NTU and maximum event NTU. A sensor selected only for the maximum event may be weak at low clean-water values, while a low-range sensor may saturate during storm or wastewater events.
A: It measures optical scattering caused by suspended particles and usually reports turbidity in NTU.
A: Verified ranges include 0 to 20.00 NTU, 0 to 100.0 NTU and 0 to 1000.0 NTU, with resolution depending on range.
A: No. Choose low range for clean water sensitivity and higher range for dirty water or event monitoring.
A: Yes. NiuBoL turbidity sensors support RS485 Modbus RTU for PLC, data logger, RTU or SCADA integration.
A: Bubbles, dirty optical windows, sediment burial, algae, poor flow and non-representative sampling points are common causes.
A: No. Turbidity is optical NTU, while TSS is suspended solids concentration. Correlation may require site-specific calibration.
A: Check baseline reading, cleaning effect, communication, alarm threshold, historical data and comparison with a reference method.
A: Self-cleaning is useful in remote, algae-rich, sediment-heavy or wastewater points where manual cleaning is expensive.
A: Send water type, normal and maximum NTU, installation photos, power, output, cable length and maintenance access.
A turbidity sensor should be selected by range, water condition and maintenance access. Verified NTU specifications are only the starting point. For stable online monitoring, buyers must define installation point, cleaning method, RS485 integration and reference check procedure. NiuBoL turbidity sensors can support drinking water, river, reservoir and wastewater monitoring when those conditions are clear.
Prev:Dissolved Oxygen Probe Maintenance: Cleaning, Calibration and Troubleshooting
Next:Ammonia Sensor for Water: Methods, Applications and Selection Criteria
Related recommendations
Sensors & Weather Stations Catalog
 Agriculture Sensors and Weather Stations Catalog-NiuBoL.pdf
Weather Stations Catalog-NiuBoL.pdf
Agriculture Sensors Catalog-NiuBoL.pdf
Water Quality Sensor Catalog-NiuBoL.pdf
Related products
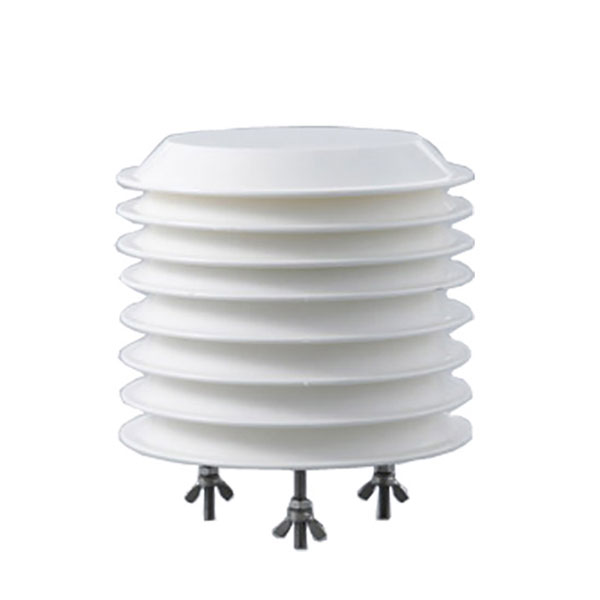 Combined air temperature and relative humidity sensor
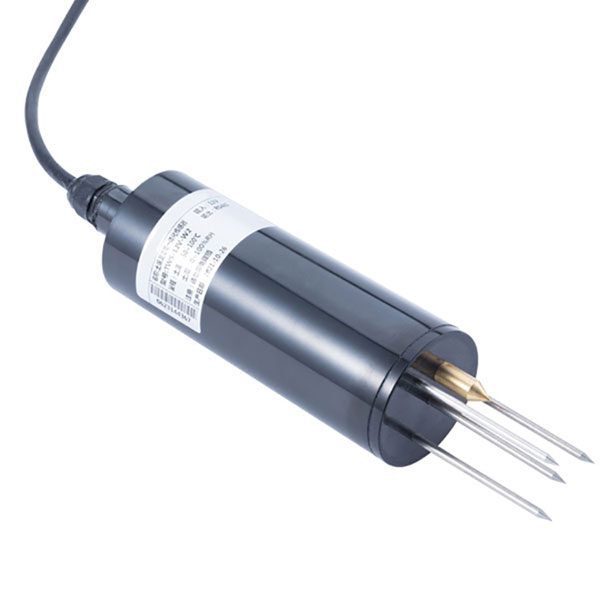 TDR Soil Moisture & Temperature Sensor for irrigation| RS485 |4-20mA| NBL-S-THR
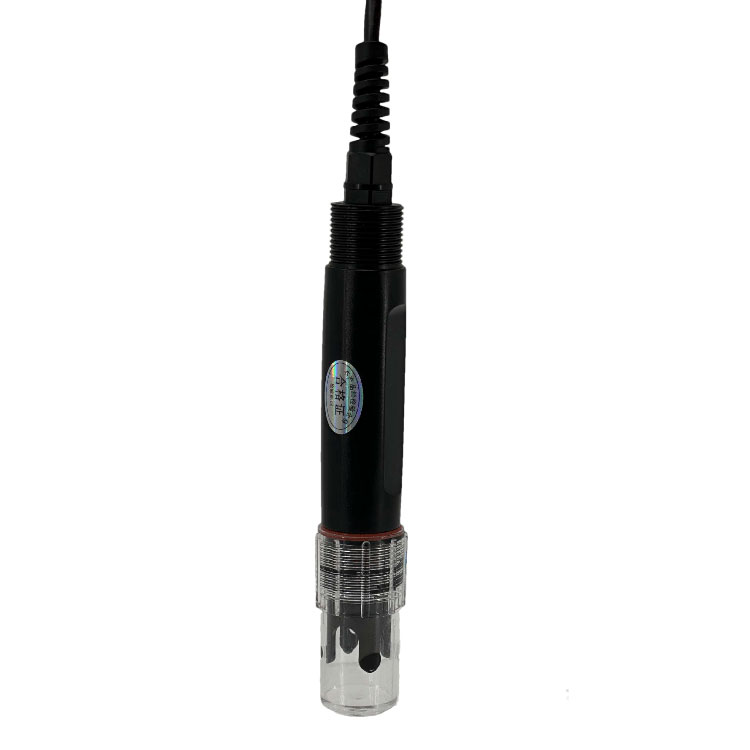 Soil pH sensor RS485 soil Testing instrument soil ph meter for agriculture |NBL-S-PH
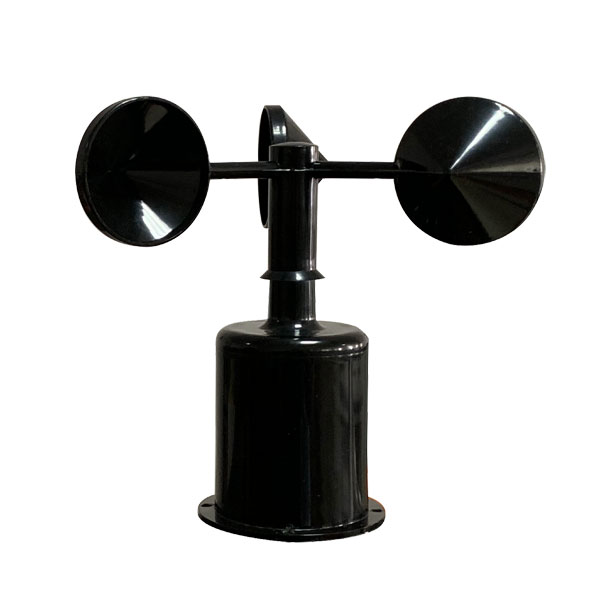 Wind Speed sensor Output Modbus/RS485/Analog/0-5V/4-20mA
 Tipping bucket rain gauge for weather monitoring auto rainfall sensor RS485/Outdoor/stainless steel
 Pyranometer Solar Radiation Sensor 4-20mA/RS485

Screenshot, WhatsApp to identify the QR code
WhatsApp number:+8615367865107
(Click on WhatsApp to copy and add friends)