

— Blogs —
—Products—
 Consumer hotline +8618073152920
WhatsApp:+8615367865107
Address:Room 102, District D, Houhu Industrial Park, Yuelu District, Changsha City, Hunan Province, China
Product knowledge
Time:2026-09-14 08:00:00 Popularity:203
Quick Answer: Wastewater online monitoring system equipment should be selected by treatment stage. Influent instruments identify incoming changes; biological-process instruments help explain treatment conditions; outlet instruments track treated-water quality. A single multi-parameter assembly cannot replace measurements at different process locations. Choose each channel for an operating decision, then connect the results with flow, equipment status and an appropriate verification method.
The useful starting document is a process drawing with measuring points, not a list of every available sensor. Mark the incoming wastewater, equalization tank, biological zones, clarification or filtration stage and final outlet. Beside each location, write the decision that requires a measurement: investigate an incoming batch, check neutralization, assess aeration, identify solids carryover or review discharge conditions.
This approach preserves an important distinction between process operation and formal reporting. An instrument that helps an operator see a disturbance may not use the method required for a discharge report. Define both duties before comparing equipment. Otherwise, an inexpensive trend sensor may be ordered against an analytical requirement it cannot fulfill, or a slow analytical instrument may be expected to provide a fast control signal.
| Treatment location | Useful observations | Decision supported |
|---|---|---|
| Influent or equalization | pH, conductivity, flow and a suitable organic-load indicator | Recognize an incoming change and investigate its source or treatment implications |
| Neutralization | pH after adequate mixing, with dosing and flow status | Assess the result of chemical addition without measuring a local concentrated plume |
| Aerobic treatment zone | Dissolved oxygen, temperature and relevant nitrogen measurements | Distinguish oxygen conditions from evidence of treatment performance |
| Clarifier or filter outlet | Turbidity or a suitable suspended-solids channel | Identify particle carryover and direct inspection of the separation stage |
| Final outlet | Parameters and methods required by the project, plus flow and operational context | Review the released water and support the applicable sampling or reporting program |
Not every plant needs every row. A small installation may gain more from a reliable pH point at its neutralization outlet than from a large multi-parameter package at an unrepresentative location. Conversely, a variable industrial influent may require several observations because one parameter cannot distinguish concentration changes, dilution and a change in wastewater chemistry.
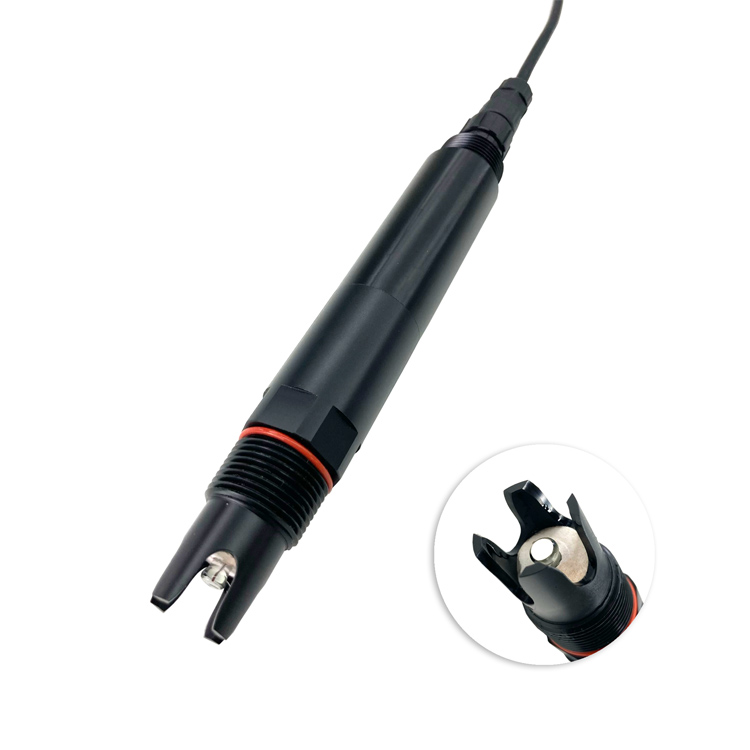
A pH probe immediately beside a dosing inlet can respond strongly to the added chemical before it is distributed through the tank. A probe too far downstream may respond only after a substantial delay. Locate the measuring point where mixing represents the stream the operator intends to control, then account for the travel time between dosing and measurement.
Keep pH measurement and dosing logic as separate design tasks. The probe supplies a value; the controller determines how that value affects a pump or valve. During sensor removal, cleaning or loss of communication, the system needs a defined operating mode rather than continuing to treat the last value as current. The acceptable response depends on the treatment process and must be agreed by its designer.
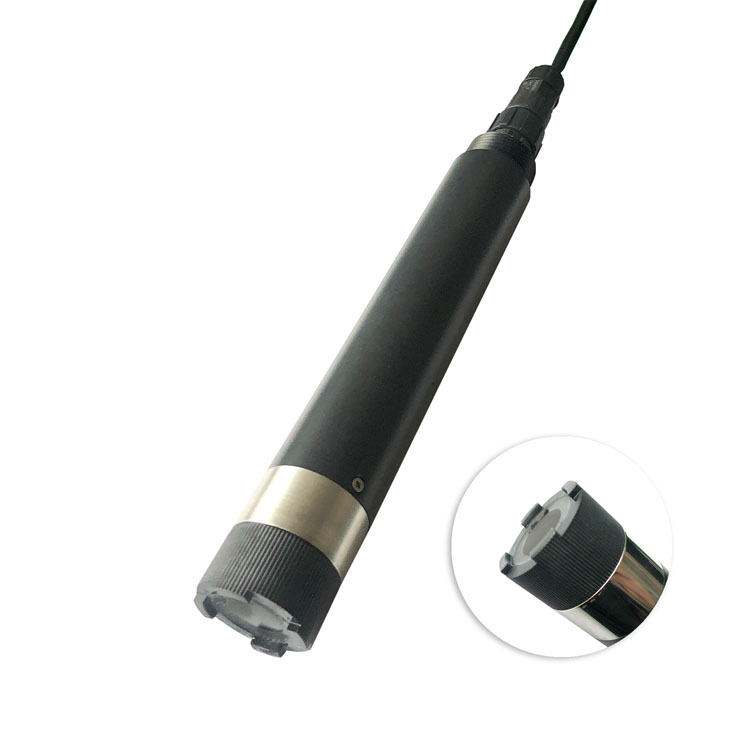
The NiuBoL NBL-WQ-COD uses dual-wavelength ultraviolet absorption, including a reference measurement for turbidity compensation. It provides an optical estimate associated with organic content. That can help follow incoming or treated-water changes, but the relationship with a laboratory COD method depends on the wastewater composition.
A change in production chemistry can change that relationship. Some materials absorb strongly at the measurement wavelength and others do not. Oil, color, particles, bubbles and window deposits can also affect interpretation. Turbidity compensation reduces a source of optical interference; it does not make every wastewater matrix equivalent or remove the need for field comparisons.
| NBL-WQ-COD item | Specification | Equipment-selection consequence |
|---|---|---|
| COD range options | 0-200 or 0-500 mg/L equivalent KHP | Select for the intended point, including expected excursions |
| Associated turbidity ranges | 0-100 or 0-200 NTU, respectively | Check both ranges when assessing a dirty influent |
| COD resolution and stated accuracy | 0.1 mg/L; +/-5% | Define the percentage basis and comparison conditions in the acceptance specification |
| Turbidity accuracy | +/-5% FS | Assess error against the selected range, not only the display increment |
| Supply and consumption | 12-24 V DC; 0.3 W at 12 V | Do not treat this figure as a complete cabinet or cleaning-peak power budget |
| Interface | RS485, Modbus RTU | Requires a digital master; an analog input alone cannot read the probe |
| Operating conditions | 0-45 C; pressure below 0.1 MPa | Check temperature and pressure at the actual measuring point |
| Housing and protection | 316L stainless steel; IP68 | Assess chemical exposure and protect external connections separately |
| Cable | 5 m standard; four-core twisted-pair shielded construction | Confirm jacket compatibility and extension arrangements for the route |
| Installation | Immersion, with automatic cleaning brush | Provide a rigid support and access to inspect the optical window and brush |
The COD configuration should therefore be selected after reviewing representative samples or historical measurements from that point. A 0-500 mg/L range is not a suitable direct reading range for a stream regularly above 500 mg/L. A larger-range model or a different analytical arrangement may be necessary; clipping an over-range value at the display maximum does not solve the problem.
Dissolved oxygen indicates the oxygen present around the sensor. It does not directly measure ammonia removal, biomass health or the amount of biodegradable material remaining. Review DO with the operating stage, temperature and appropriate nitrogen or organic-load observations when those are needed to diagnose performance.
Place a DO probe where the reading represents the intended zone and avoid interpreting a highly localized aeration plume as the condition of the whole basin. If the plant has alternating aerobic and anoxic phases, label the phase in the record. A low oxygen value during an intended anoxic period has a different meaning from the same value during an aerobic operating period.
When separate instruments serve different zones, keep location in the tag name. Two tags called simply DO are easy to confuse during commissioning or maintenance. A useful tag identifies the basin, zone and parameter, with units stored separately. Preserve those identities when a replacement probe is installed so the historical series does not silently change location.
Turbidity and suspended-solids concentration are related observations, not interchangeable units. An NTU reading describes optical response; a solids concentration in mg/L depends on the instrument method and its relationship with the particles present. Do not assign a universal conversion factor between them.
A turbidity increase at a clarifier outlet can justify checking solids carryover, flow changes or a disturbance in the separation process. It does not by itself identify a particular contaminant. For activated sludge concentration, select an MLSS instrument suited to the expected concentration and sludge properties rather than assuming that an outlet turbidity probe is suitable inside the biomass zone.
Consider the normal background as well as the upset range. A wide-range immersion sensor may tolerate a dirty stream but lack the low-range performance required for a polished outlet. Compare accuracy and detection capability at the concentration of interest; additional display digits do not establish an ability to resolve a small treatment change.
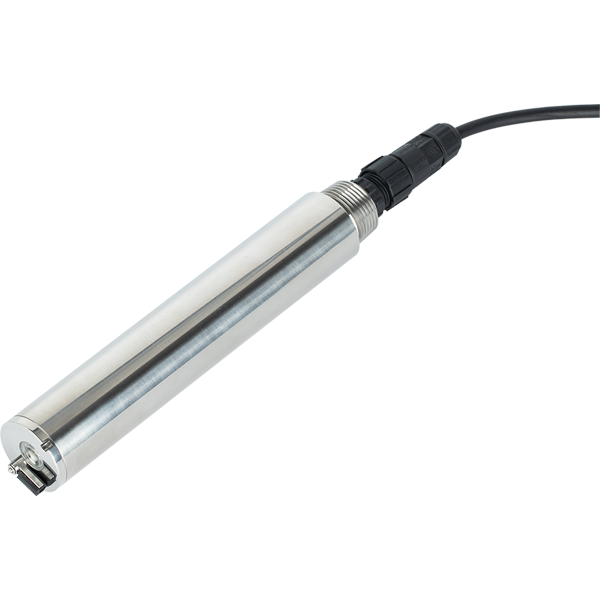
RS485 Modbus RTU sensors connect to a PLC, RTU or data logger that acts as the master. The host needs the register definition for each exact model, not a generic water-sensor driver. For example, the NBL-WQ-COD provides separate value and decimal-place registers for COD, temperature and turbidity. A returned integer of 866 with one decimal place represents 86.6 mg/L, not 866 mg/L.
Store sensor acquisition time separately from the time a remote platform receives the record. Include process events such as aeration changes, filter backwash or batch transfer when they are relevant to interpretation. An apparent correlation between two channels can disappear when one is delayed by sample delivery or buffered transmission.
Comparing inlet and outlet concentrations at the same clock time is particularly risky. The outlet may contain water that entered hours earlier, and equalization and recirculation can broaden the residence-time distribution. A same-time concentration ratio is not automatically a treatment-removal efficiency. Use a sampling and flow-accounting approach appropriate to the process before calculating a performance figure.
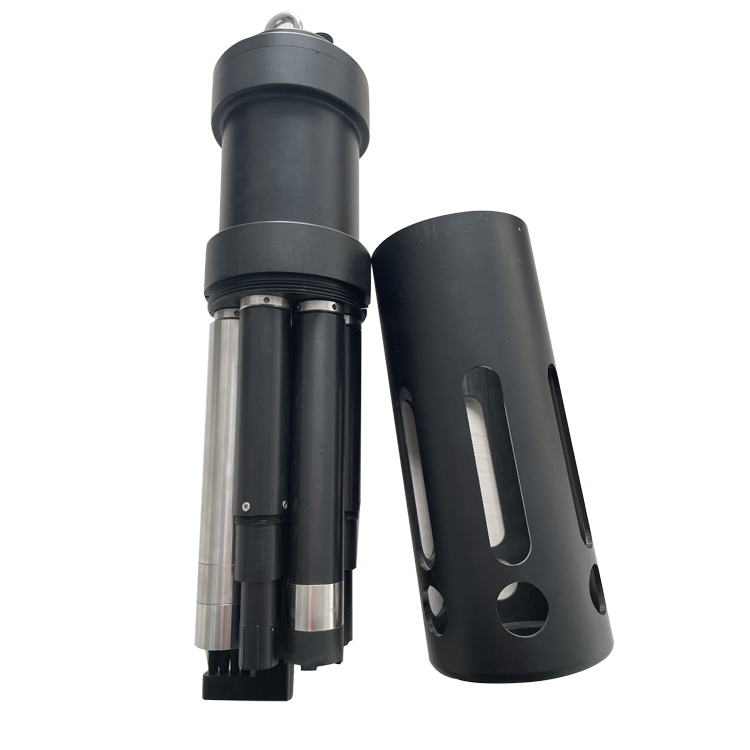
A multi-parameter assembly can simplify installation when several channels genuinely belong at the same point. Its fitted module list must still match the application. Separate probes may be more practical when maintenance schedules differ or when the measurements belong in different basins. Price the selected arrangement, including mounting and integration, rather than treating a multi-parameter product name as a complete wastewater monitoring system.

It can combine several parameters at one location. It cannot represent influent, biological treatment and final outlet simultaneously. Use the process drawing to decide how many measuring points are needed before deciding whether each point should use separate probes or an integrated assembly.
Choose the point according to the question and the sensor's usable range. An inlet channel follows incoming changes; an outlet channel follows treated water. Both require matrix validation, and a dirty or high-strength inlet may exceed the selected model's COD or turbidity range.
Not by simply changing the displayed unit. MLSS duty involves a different concentration range and a sludge-dependent relationship with the optical measurement. Select and validate the appropriate solids measurement for the basin rather than converting an outlet NTU value with an assumed factor.
The PLC may lack an RS485 port, Modbus RTU master functionality or a driver capable of decoding the register format. An approved gateway or interface module may resolve the mismatch. Establish the actual hardware and software requirements before assuming that a serial connector guarantees integration.
No general claim is justified. Online sensors provide frequent process observations, while laboratory comparisons and any required reporting methods remain separate obligations. Agree the intended use of each channel and its verification procedure before assigning compliance or treatment-performance claims to the data.
Send the treatment flow diagram, proposed locations, normal and upset ranges, wastewater characteristics and existing controller details. Identify which measurements support operation and which support formal reporting. These details allow NiuBoL to discuss suitable probes without pricing unnecessary channels or an unsuitable range.
Useful wastewater online monitoring system equipment connects each treatment stage with a specific operating question. NiuBoL COD, pH, dissolved oxygen, turbidity and multi-parameter options can form part of that arrangement when their ranges and methods suit the water. The result should be a readable process record that helps operators locate a problem, not a collection of numbers from one convenient mounting point.
Prev:Secondary Water Supply Monitoring System Functions for Pump Room Integration
Next:Fixed Water Quality Testing Instrument Selection for Permanent Monitoring Points
Related recommendations
Sensors & Weather Stations Catalog
 Agriculture Sensors and Weather Stations Catalog-NiuBoL.pdf
Weather Stations Catalog-NiuBoL.pdf
Agriculture Sensors Catalog-NiuBoL.pdf
Water Quality Sensor Catalog-NiuBoL.pdf
Related products
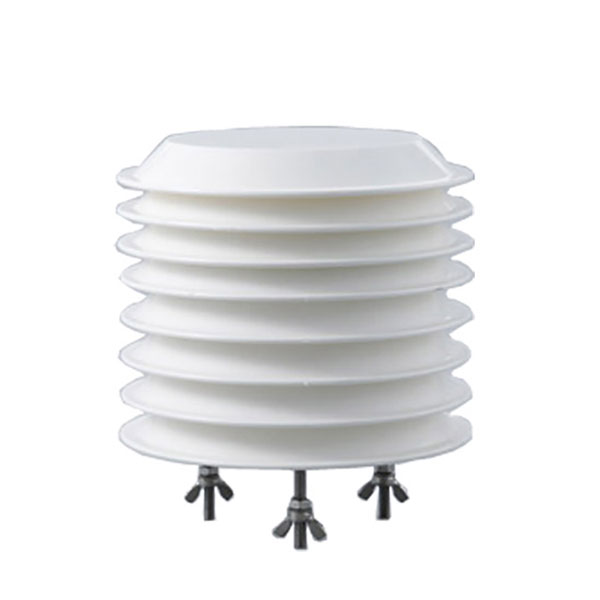 Combined air temperature and relative humidity sensor
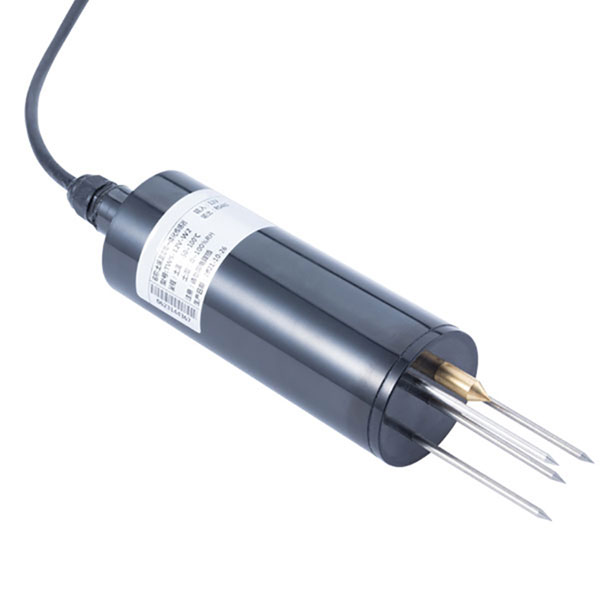 TDR Soil Moisture & Temperature Sensor for irrigation| RS485 |4-20mA| NBL-S-THR
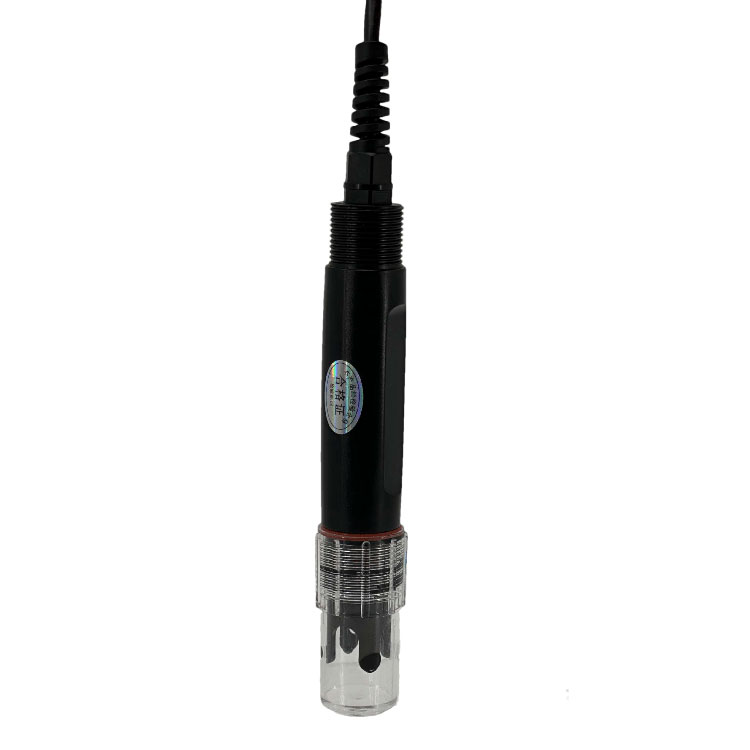 Soil pH sensor RS485 soil Testing instrument soil ph meter for agriculture |NBL-S-PH
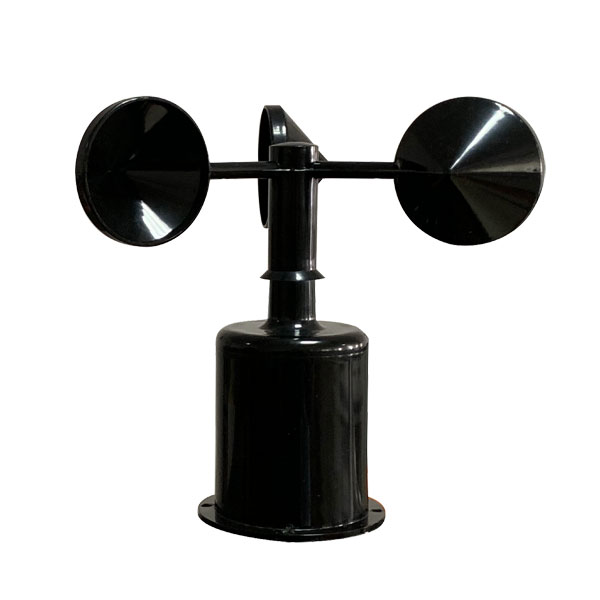 Wind Speed sensor Output Modbus/RS485/Analog/0-5V/4-20mA
 Tipping bucket rain gauge for weather monitoring auto rainfall sensor RS485/Outdoor/stainless steel
 Pyranometer Solar Radiation Sensor 4-20mA/RS485


Screenshot, WhatsApp to identify the QR code
WhatsApp number:+8615367865107
(Click on WhatsApp to copy and add friends)