

— Blogs —
—Products—
 Consumer hotline +8618073152920
WhatsApp:+8615367865107
Address:Room 102, District D, Houhu Industrial Park, Yuelu District, Changsha City, Hunan Province, China
Product knowledge
Time:2026-09-15 14:00:00 Popularity:218
Quick Answer: Online water quality monitoring provides observations between visits, making short events and daily patterns easier to investigate. Its value depends on representative measurement, valid records and an operator who can respond. It does not automatically identify a contaminant, replace every laboratory method or prove that an entire waterbody meets its requirements.
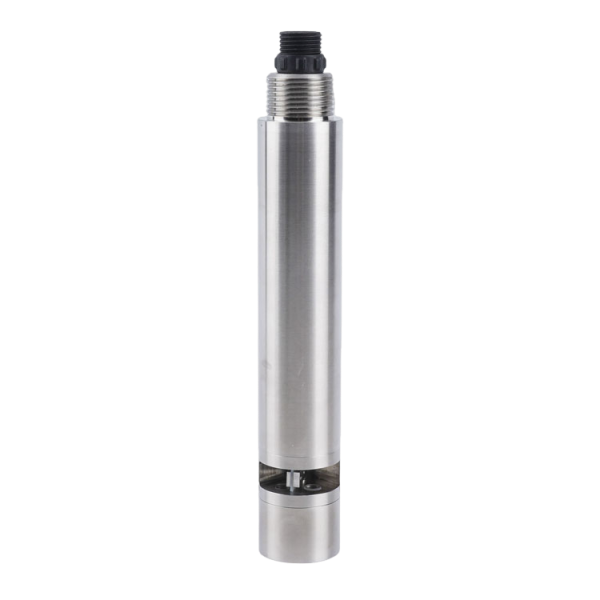
A manual sample describes water collected at a particular place and time. A fixed online point adds a sequence of observations at that location. The sequence can show whether an unusual result lasted several minutes, recurred after a pump cycle or developed gradually overnight. Those distinctions can change the next inspection or sampling decision.
Continuity is not the same as perfect event capture. An event may occur between measurements, outside the probe's range or at another depth. Fouling and loss of sample flow can also create a believable but invalid record. Assess the proposed system by the event it needs to observe rather than by the word continuous on a specification sheet.
An online COD probe is a useful example. It can follow a changing optical response associated with organic content, but the relationship with laboratory COD depends on the water. A well-timed optical excursion can justify targeted sampling. It cannot identify the substance responsible or make the optical method analytically equivalent to a different test.
| Project question | What an online record adds | What still requires investigation |
|---|---|---|
| Does a treatment inlet receive intermittent changes? | Timing, duration and recurrence between operator rounds | Source attribution and confirmation of the suspected constituent |
| Is a pond experiencing overnight oxygen stress? | The period before sunrise rather than only daytime inspections | Whether the fixed point represents other depths and areas |
| Does source water change after rainfall? | The order of conductivity, turbidity and other channel changes | Mixing, transport and the actual substances entering the source |
| Did a maintenance intervention change the trend? | A time series before and after the work | Weather, production and other changes that occurred at the same time |
For source-water monitoring, a conductivity change can help recognize arrival of water with a different ionic composition. It does not distinguish every harmless salt from a hazardous dissolved constituent. Select follow-up samples according to the suspected source rather than assigning a universal pollution meaning to the conductivity number.
A fixed station is most useful where the owner has a defined next action: inspect an inlet, check aeration, collect a sample or verify an instrument. If nobody reviews the record or receives a meaningful alarm, additional measurement frequency may simply produce more unattended data. Include the review responsibility in the project design.
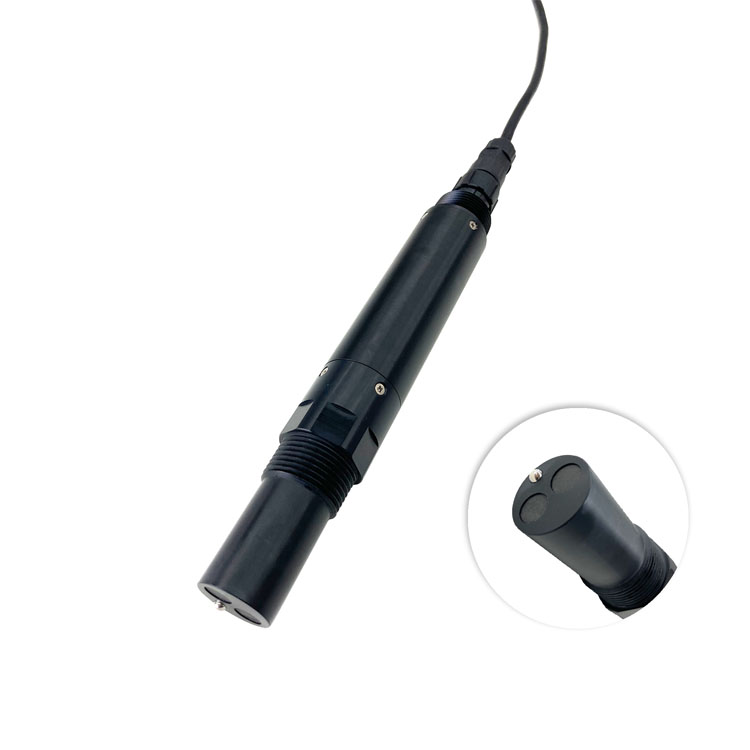
A station can send a message at every scheduled interval while repeating its last successful measurement. Another can lose its uplink but preserve valid observations locally. A message counter therefore does not measure the completeness of the water-quality record. Distinguish acquisition, validity, local retention and remote availability.
As an illustrative daily calculation, five-minute recording creates 288 scheduled observations. If twelve are invalid, 276 valid observations represent 95.83% coverage. That percentage does not show when the gap occurred. Losing the hour around an expected discharge can matter more than the same gap during a stable period.
Review coverage for each channel as well as for the station. A functioning temperature channel does not prove that a fouled optical window or failed electrode is producing valid values. Record maintenance and unavailable periods explicitly instead of filling them with zeros or silently interpolating through the event of interest.
Optical BOD monitoring also requires a clear interpretation. It may provide a useful surrogate trend after suitable site evaluation; a continuously updated value is not a laboratory BOD5 result obtained instantly. Keep the measurement method and any fitted relationship identifiable in exported records and reports.

The sensor must cover the expected normal and event range with useful uncertainty. A display ceiling can conceal the size of an excursion. A wide range can also be unsuitable for small changes near a low background. Define the concentration or physical change that should trigger investigation before choosing a range.
| NBL-WQ-COD example | Specification | Limit on the monitoring claim |
|---|---|---|
| Principle | Dual-wavelength ultraviolet absorption | Requires assessment against the actual water and intended interpretation |
| COD ranges | 0-200 or 0-500 mg/L equivalent KHP | Choose the appropriate version; over-range readings do not quantify a larger event |
| Associated turbidity ranges | 0-100 or 0-200 NTU, respectively | Check particle conditions as well as the selected COD range |
| COD resolution and stated accuracy | 0.1 mg/L; +/-5% | Agree the accuracy basis and comparison conditions for acceptance |
| Supply and consumption | 12-24 V DC; 0.3 W at 12 V | These figures do not size a complete station or establish cleaning peak demand |
| Output | RS485 Modbus RTU | Local digital acquisition needs a compatible host; remote alarms are separate |
| Operating water conditions | 0-45 C; pressure below 0.1 MPa | Check the actual point, including any sample arrangement |
| Construction | 316L housing; IP68; standard 5 m shielded cable | Protect connections and provide access to the optical window and brush |
Even a suitable probe cannot eliminate sample transport delay. In a pumped station, tubing, the flow cell and the instrument response all contribute to the time represented by a reading. Logging faster does not remove that delay. For an alarm intended to guide an immediate action, evaluate the complete path rather than the update rate alone.
A remote alarm needs a valid condition, a destination and an agreed response. Test whether the responsible operator receives it during the periods the project must cover. An alarm on a dashboard that is checked only at the next shift may not meet the intended warning duty.
Automatic control is a further decision. A rising value does not by itself establish which pump, valve or dosing action is appropriate. The process designer must address response delays, actuator limits and invalid measurements. Monitoring can support that strategy but should not be presented as a complete control safeguard solely because the probe has a digital output.
Suspended solids measurements illustrate the need for interpretation. A rise can accompany sediment disturbance, treatment carryover or changing particles. Turbidity in NTU cannot be converted to solids in mg/L with a universal factor. The trend can direct an inspection while parameter-specific verification determines how it should be quantified.

Add another point when the unanswered question is spatial. An intake station cannot necessarily represent an isolated bay, and one depth cannot resolve a stratified water column. A preliminary survey can show whether relocating a probe or adding a second location is more useful than adding several parameters at the original point.
Retain appropriate laboratory or attended measurements where the required constituent or analytical method is outside the installed channels. Online monitoring can improve the timing of those samples. It should not be justified through a claim that every independent check will disappear or that a multi-parameter assembly measures all possible contaminants.
For a NiuBoL configuration review, describe the event duration, parameter, expected range and action the operator would take. Include the proposed point and available maintenance access. Evaluate a trial on valid coverage and useful decisions, not only on a smooth dashboard or the number of installed modules.
The online record can show changes occurring between visits and describe their timing. Whether it captures the event depends on acquisition interval, response, location and validity. A fixed point adds temporal coverage; it does not automatically add spatial coverage.
No. Frequency and accuracy are different specifications. Frequent readings from a biased or fouled instrument can describe the wrong trend in greater detail. Verify measurement performance independently from the acquisition schedule.
No such general guarantee follows from continuous installation. Unmeasured constituents, events outside the point or range, response limitations and invalid periods remain possible. Define which events the proposed configuration can reasonably investigate and how its blind spots are addressed.
It can continue local acquisition if the host, power and storage arrangement support that function. Demonstrate retention and later recovery of original timestamps. Losing remote access and losing the actual measurements are different failures.
Agree a representative trial period and the decisions it should support. Review valid channel coverage, relevant event records, comparison results and the effort needed to maintain them. A commissioning demonstration alone does not establish long-term usefulness.
It combines related observations at one location, which can help interpret changes in that water. It does not replace other locations or every analytical method. Specify the fitted modules and assess whether their shared installation and service arrangement suit the project.
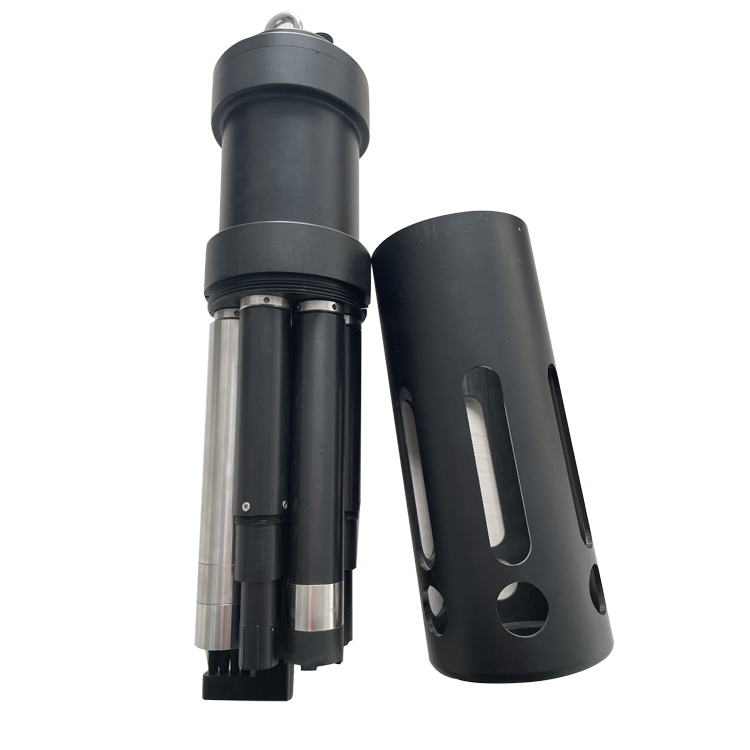
Online water quality monitoring is valuable when its time series changes what the operator can investigate or respond to. Assess valid coverage, response and location before claiming that benefit. NiuBoL sensors and selected multi-parameter assemblies can provide the observations, while suitable verification and an explicit response plan make them useful.
Prev:Water Quality Online Monitoring Equipment: Logger and Gateway Selection
Next:Water Quality Monitoring System Maintenance: Responsibilities and Recovery
Related recommendations
Sensors & Weather Stations Catalog
 Agriculture Sensors and Weather Stations Catalog-NiuBoL.pdf
Weather Stations Catalog-NiuBoL.pdf
Agriculture Sensors Catalog-NiuBoL.pdf
Water Quality Sensor Catalog-NiuBoL.pdf
Related products
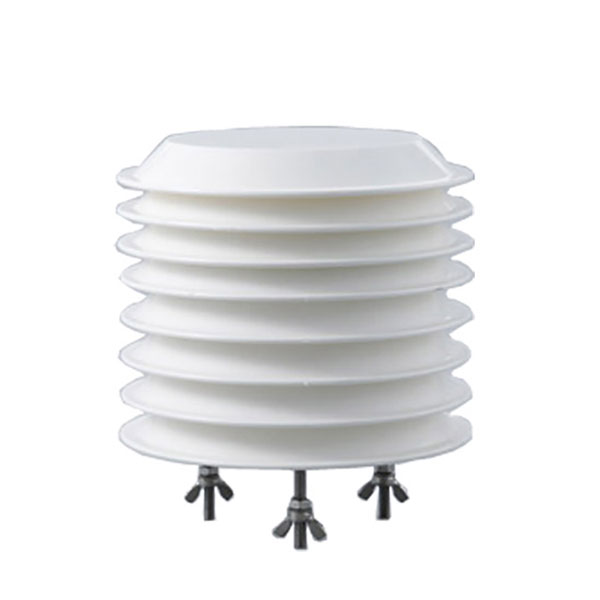 Combined air temperature and relative humidity sensor
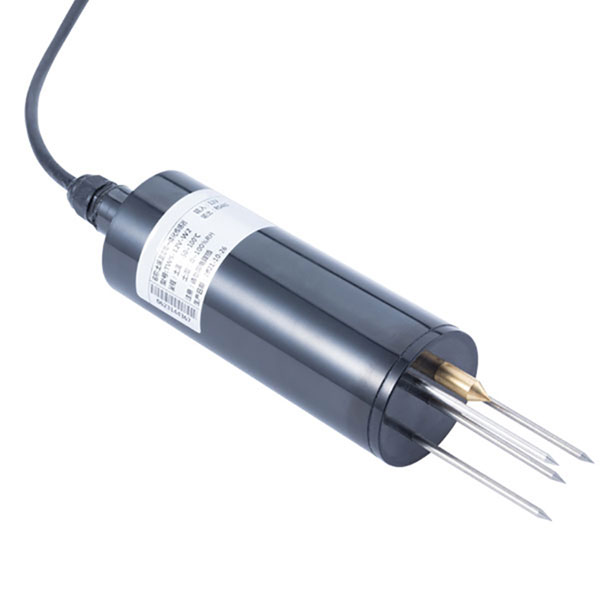 TDR Soil Moisture & Temperature Sensor for irrigation| RS485 |4-20mA| NBL-S-THR
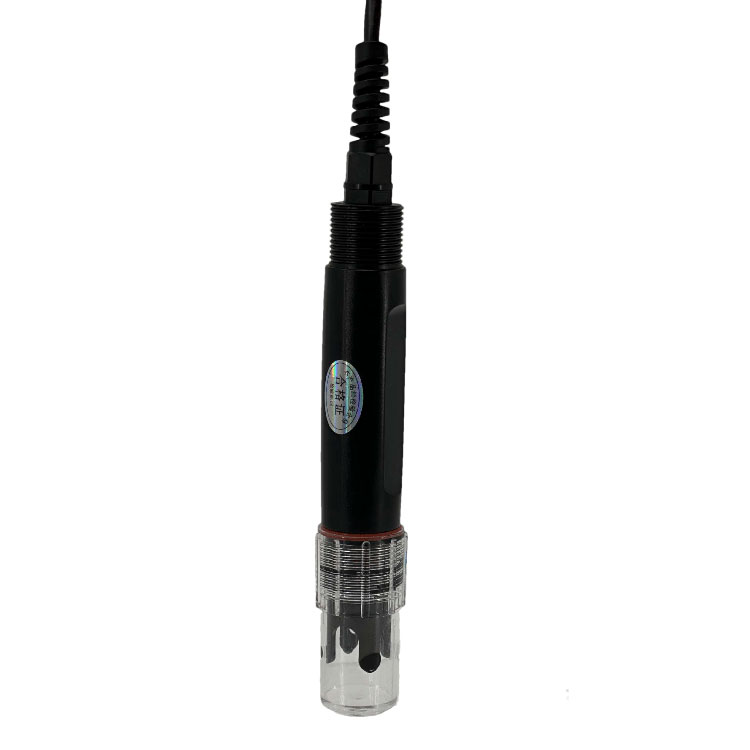 Soil pH sensor RS485 soil Testing instrument soil ph meter for agriculture |NBL-S-PH
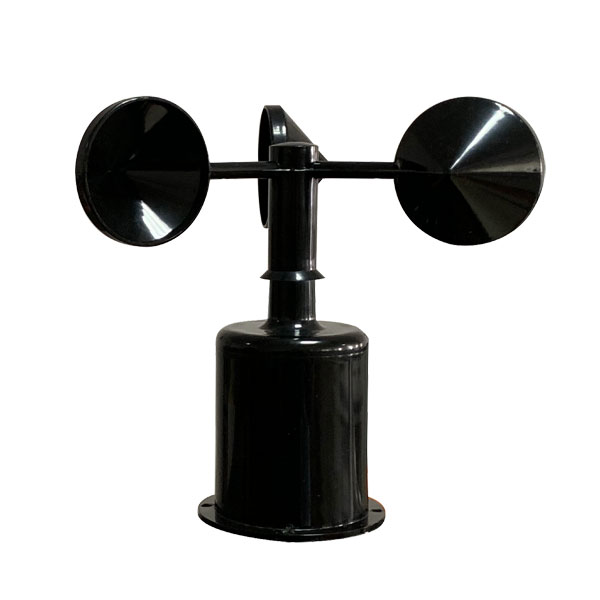 Wind Speed sensor Output Modbus/RS485/Analog/0-5V/4-20mA
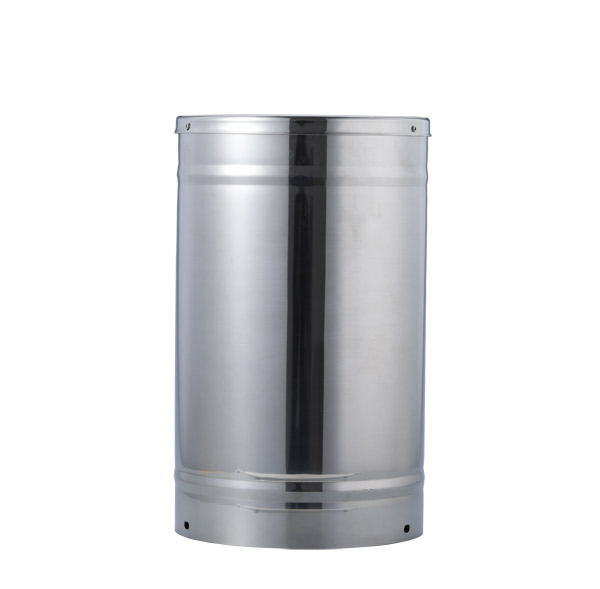 Tipping bucket rain gauge for weather monitoring auto rainfall sensor RS485/Outdoor/stainless steel
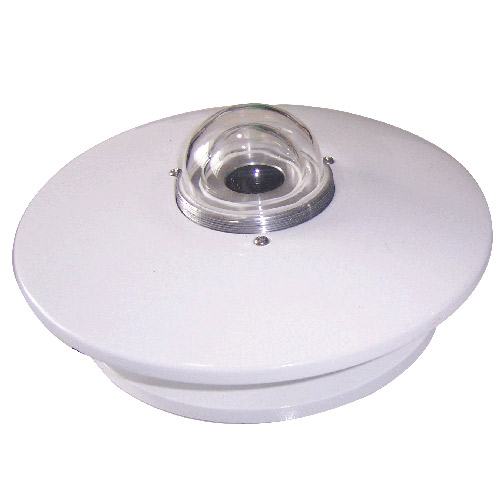 Pyranometer Solar Radiation Sensor 4-20mA/RS485

Screenshot, WhatsApp to identify the QR code
WhatsApp number:+8615367865107
(Click on WhatsApp to copy and add friends)