

— Blogs —
—Products—
 Consumer hotline +8618073152920
WhatsApp:+8615367865107
Address:Room 102, District D, Houhu Industrial Park, Yuelu District, Changsha City, Hunan Province, China
Product knowledge
Time:2026-09-24 09:00:00 Popularity:189
Emergency river pollution monitoring is useful only if detection and notification leave enough time for the intended response. Compare the available river travel time with sampling delay, instrument response, acquisition, transmission, investigation and action. A fast sensor does not establish a fast warning system, and an unchanged set of general water-quality indicators cannot rule out every contaminant.
Identify the control point: an intake, diversion, process entry or location where a response can actually be implemented. Determine who can authorize the action and how long implementation takes. Placing a station beside that point may provide useful operating data but little advance warning.
The EPA source-water monitoring guidance relates monitoring location to the time needed to investigate a change and implement a response. Its design approach also accounts for sample transport when water is conveyed to a flow cell. This is a planning principle, not evidence that any particular NiuBoL installation has a specified warning time.
Use site-appropriate hydraulic information for the river condition of concern. Channel changes, tributary entry, incomplete mixing and changing flow can alter which water reaches a fixed probe and when. A convenient upstream distance should not be converted into a promised lead time without that assessment.
| Delay component | What to establish | Practical check |
|---|---|---|
| Water delivery | Whether the probe is immersed or supplied through a sample line | Measure or estimate transport and renewal at the actual point; include stagnant or interrupted flow. |
| Instrument response | Response in the relevant matrix and measuring region | Do not equate the serial update rate with a completed measurement response. |
| Acquisition and event logic | Poll interval, persistence test and alarm-processing interval | Test an event arriving just after a poll, not only immediately before one. |
| Communication and delivery | Upload cycle, network availability and alarm route | Measure arrival at the responsible operator's device. |
| Investigation and action | Verification, authorization and physical response time | Exercise the actual procedure and record completion, not only message receipt. |
For illustration, an assumed 40-minute available lead time is consumed quickly by 5 minutes of acquisition delay, 3 minutes of transmission and alert handling, 12 minutes of investigation and 15 minutes of action: 35 minutes in total. Only 5 minutes remain before adding sample transport and instrument response. These are constructed planning values, not river measurements, model specifications or a recommended safety margin.
Adding a faster modem cannot recover time lost to an unsuitable location or a slow approval route. Compare alternatives by the part of the delay they actually change. A different station position, shorter sample path or rehearsed operating procedure may be more consequential than the sensor's reporting frequency.
A turbidity observation can identify particle changes but cannot identify their chemical cause. Conductivity, pH and DO add different observations where the selected station includes them. A release that does not materially change those indicators may escape that configuration, so define the known detection limits of the monitoring approach.
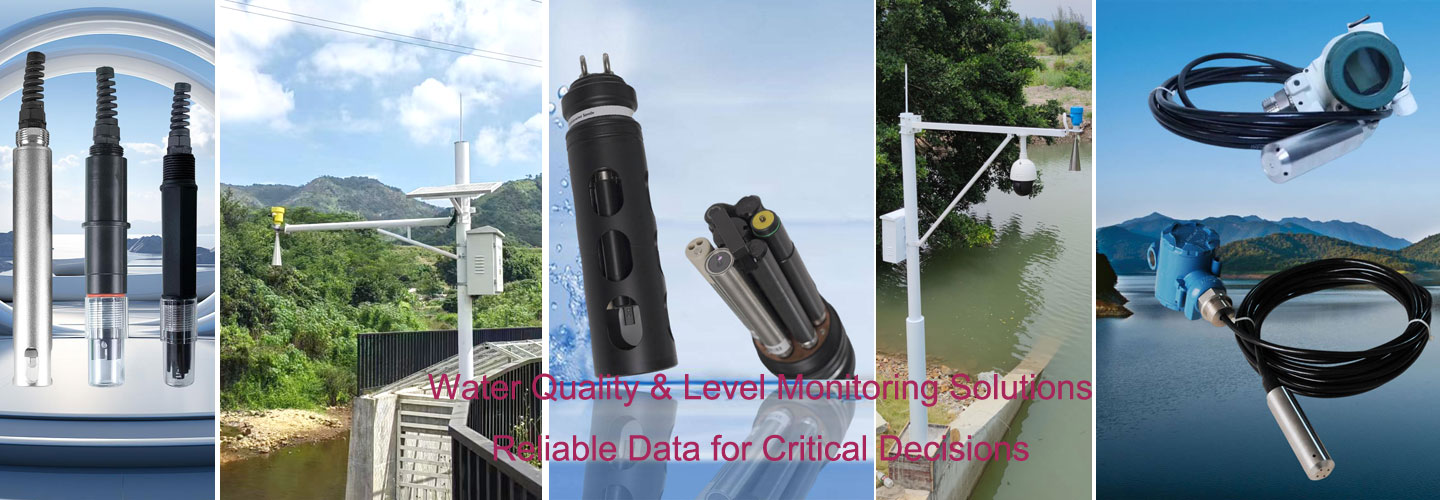
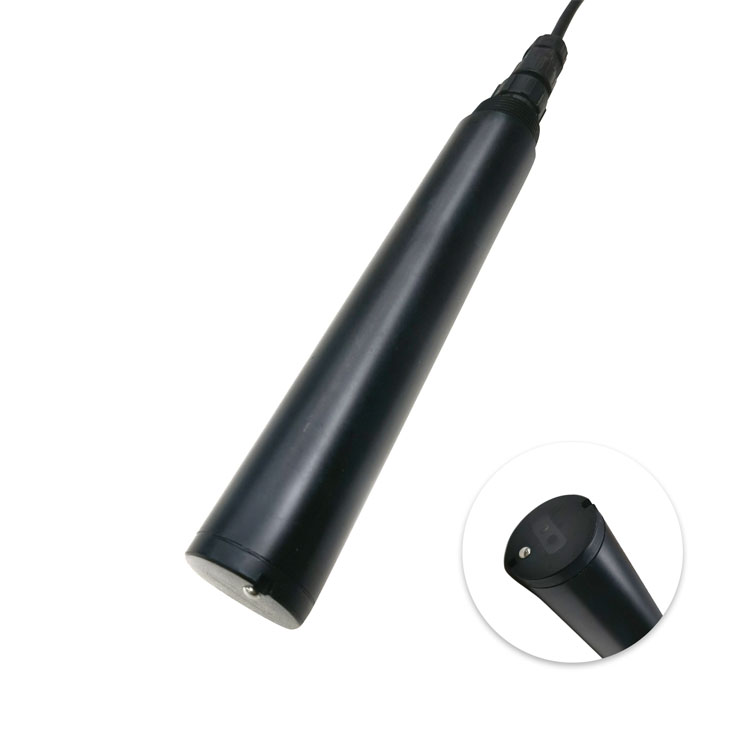
An optical organic-load channel can add another type of trend. The NBL-WQ-BOD-4A shown below estimates a relationship associated with fluorescent organic matter; it does not perform a five-day incubation test or identify every toxic compound. Evaluate whether the threatened water change produces a useful response before relying on that channel for warning.

| NiuBoL instrument option | Relevant limits | Warning-system use |
|---|---|---|
| NBL-WQ-BOD-4A estimate | 0–150 mg/L; accuracy ±5% FS; resolution 0.1 mg/L | Use a validated optical relationship, not an assumed laboratory BOD or pollutant identity. |
| BOD-4A associated turbidity | 0–100 NTU; accuracy ±5% FS; resolution 0.1 NTU | Review particle conditions and the actual compensation limits. |
| BOD-4A electrical and exposure | 12–24 VDC; 0.2 W at 12 V; RS485 Modbus RTU; 0–45 °C; pressure <0.1 MPa; IP68 | Budget station hardware separately and approve the wet point. |
| BOD-4A installation | POM/316L; standard 5 m cable; no deeper than 2 m; at least 30 cm below the lowest expected water level | Protect cable joints and keep the optical region accessible and immersed. |
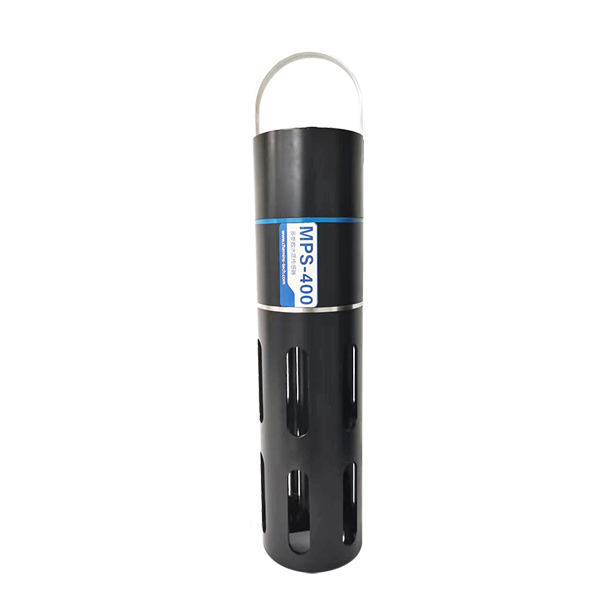
| MPS-5B assembly | Up to 6 parameters including temperature; 12 VDC; 2 W at 12 V; RS485 Modbus RTU | Specify the fitted modules and separate unavailable channels from unchanged water. |
The BOD-4A full-scale error term is 7.5 mg/L on its 150 mg/L span. Its 0.1 mg/L increment does not establish that it can discriminate small changes in a low-background river. A site trial should test the required event contrast and matrix, including conditions where the indicator may be insensitive.
A short pulse can occur between acquisition points. Lengthy averaging or a persistence requirement can also suppress the very change the station was intended to catch. Review the shortest event that matters and test whether the selected acquisition and alert logic preserves it. Avoid choosing intervals solely to reduce communication traffic.
Maintain separate statuses for normal data, a water-quality alert and unavailable monitoring. A buried, exposed or serviced probe should not produce an apparently normal river status. Preserve acquisition time through RS485, RTU and remote upload so delayed history cannot masquerade as a current warning.
For data-record implementation, the logger-to-cloud record guide covers identity and timing. The warning design must also establish what happens when live delivery fails.
Use approved simulation or a controlled instrument test to create the expected event indication. Record acquisition, alert arrival, acknowledgement and completion of the permitted response exercise. Test off-hours routing and a failed primary communication path where the project requires them. Never introduce a pollutant into the river to demonstrate detection.
For a NiuBoL inquiry, provide the threats of concern, control-point location, hydraulic information, expected water matrix, required lead time and operating procedure. State whether the station needs independent power or an alternative notification path. This supports selection of sensors and integration work against a defined response task.
No. Water transport, physical sensor response, acquisition logic, communication and human action all contribute to the total time. Verify the whole sequence.
No. Its indicators cover selected properties and locations. Specify the threats it is intended to detect and retain suitable sampling and investigation for unmeasured contaminants.
No. It is a matrix-dependent optical observation. Establish its useful relationship and event contrast rather than assigning a pollutant identity to a changing estimate.
That condition exposes acquisition delay that a conveniently timed demonstration can hide. Short events also require review of averaging and persistence settings.
The correct person receives an identifiable, timely alert and completes the approved response steps within the required window. A message displayed at the station is only one part of that result.
Review location, sample transport, notification and the response itself. Do not claim adequate warning simply by selecting a sensor with a faster communication rate.
Design emergency river pollution monitoring backward from an achievable response. Select indicators that can reveal the relevant change, budget every delay and test actual delivery and action. Record the limits of the configuration so an operating station is not mistaken for universal contamination coverage.
Prev:Pure Water and RO Monitoring: Conductivity, Turbidity, Chlorine and DO Sensors
Next:Nitrate Sensor for Agricultural Runoff: Storm Sampling and Flow Alignment
Related recommendations
Sensors & Weather Stations Catalog
 Agriculture Sensors and Weather Stations Catalog-NiuBoL.pdf
Weather Stations Catalog-NiuBoL.pdf
Agriculture Sensors Catalog-NiuBoL.pdf
Water Quality Sensor Catalog-NiuBoL.pdf
Related products
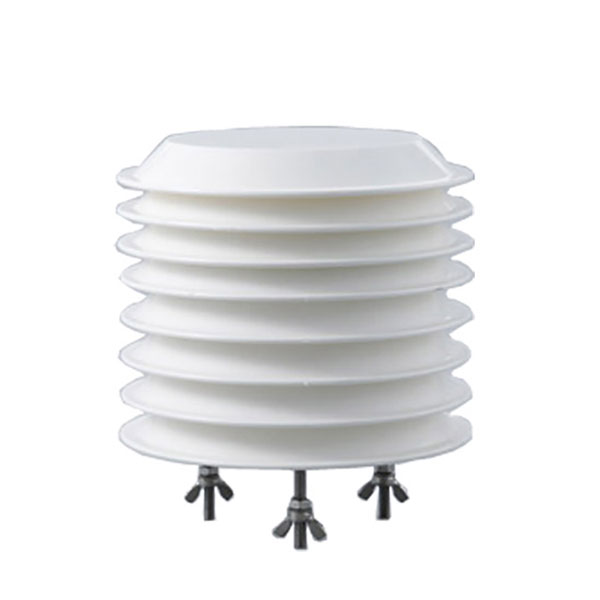 Combined air temperature and relative humidity sensor
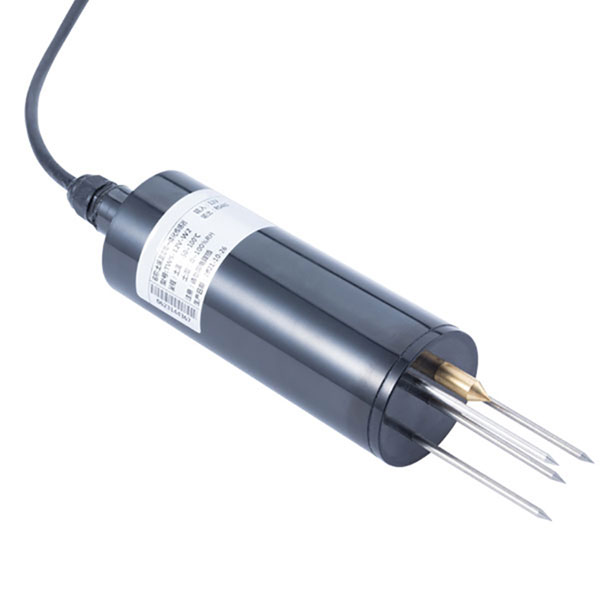 TDR Soil Moisture & Temperature Sensor for irrigation| RS485 |4-20mA| NBL-S-THR
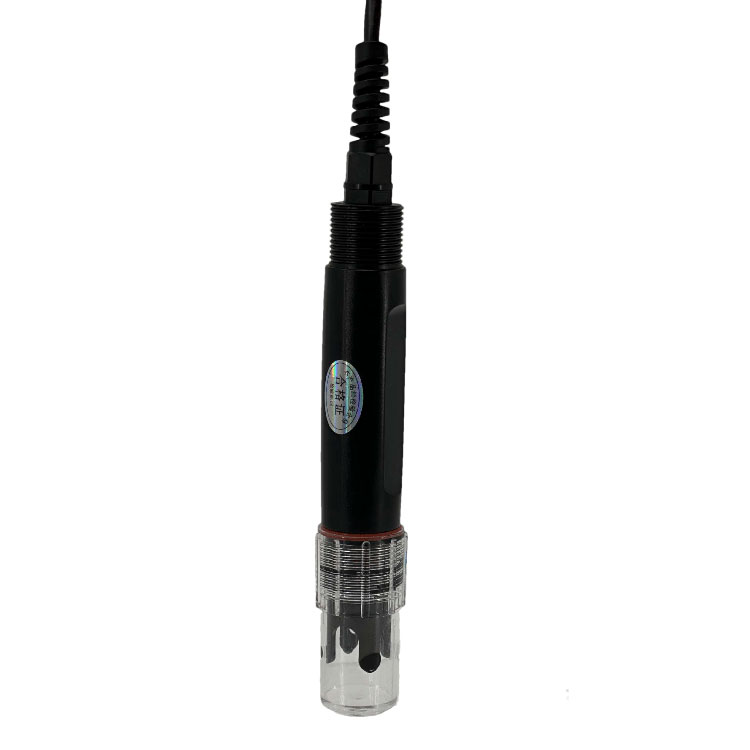 Soil pH sensor RS485 soil Testing instrument soil ph meter for agriculture |NBL-S-PH
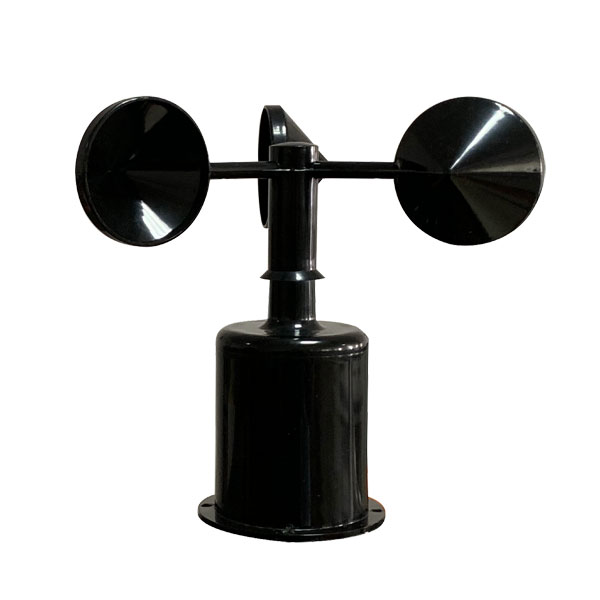 Wind Speed sensor Output Modbus/RS485/Analog/0-5V/4-20mA
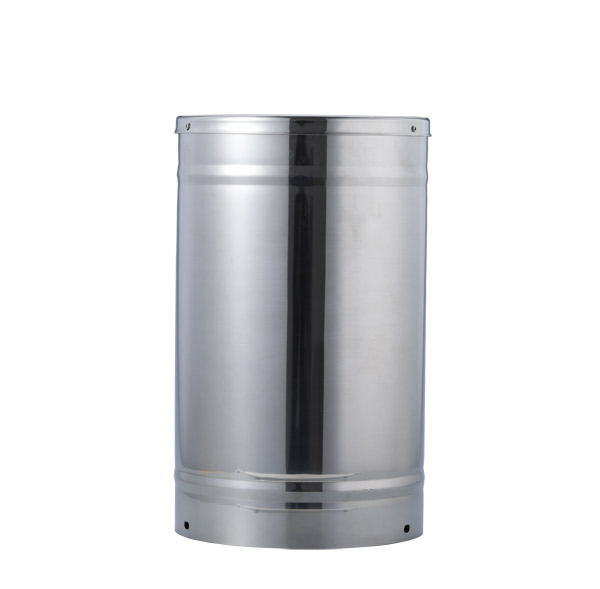 Tipping bucket rain gauge for weather monitoring auto rainfall sensor RS485/Outdoor/stainless steel
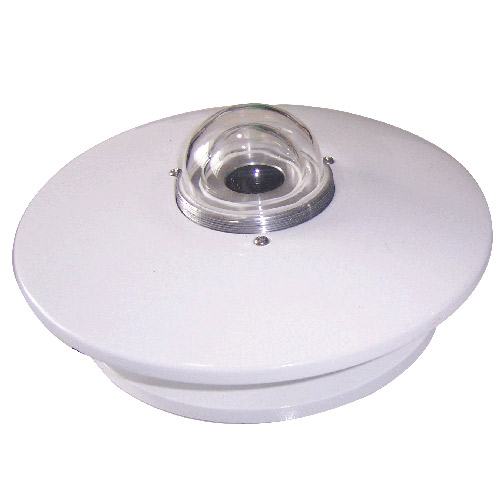 Pyranometer Solar Radiation Sensor 4-20mA/RS485


Screenshot, WhatsApp to identify the QR code
WhatsApp number:+8615367865107
(Click on WhatsApp to copy and add friends)