

— Blogs —
—Products—
 Consumer hotline +8618073152920
WhatsApp:+8615367865107
Address:Room 102, District D, Houhu Industrial Park, Yuelu District, Changsha City, Hunan Province, China
Product knowledge
Time:2026-11-07 15:51:11 Popularity:8
A negative ion monitor measures the concentration of small negative air ions, reported as ions per cubic centimeter, by collecting their charge on a biased electrode and converting a picoampere-scale current into a number. It is not an air quality index and not a detector of PM2.5 or VOCs. In the field, the reading is dominated by airflow, relative humidity and ion recombination near surfaces, so a well-installed instrument in a poor location will still produce misleading data.
The quantity of interest is the number concentration of small negative air ions, typically expressed as ions/cm³. "Small" or "light" ions are molecular clusters with an electrical mobility high enough to be swept into a collector within the instrument's residence time. Larger charged aerosol particles move far more slowly and are mostly excluded by the geometry of the inlet and by the bias voltage chosen for the collector. This distinction matters because two instruments with different mobility cut-offs can sit side by side and legitimately report different concentrations.

Figure 1. 6-in-1 Air Quality Sensor (PM2.5, CO, CO2, O3, SO2, NO2).
The sensing element is an ionization chamber, often built as a coaxial cylinder or a parallel-plate assembly. Air is drawn through the chamber at a known volumetric flow rate by a small fan or pump. A polarizing voltage is applied between an outer electrode and a central collecting electrode. Negative ions drifting to the collector give up their charge, producing a DC current in the picoampere to femtoampere range. That current is amplified by an electrometer-grade amplifier, filtered, digitized, and divided by the elementary charge and the effective sample flow to yield a concentration.
Because the measurement is a current measurement, everything that changes either the ion population or the current path changes the result. Dust on the insulator, moisture films on the electrode, leakage currents in the cable, and a drifting electrometer zero all appear as apparent ion counts. This is why a negative ion monitor is specified as a complete instrument with a defined inlet, flow path and grounding scheme, not as a bare sensor chip.
| Step | Physical quantity | Typical engineering range | Unit / condition |
|---|---|---|---|
| 1 | Air sample flow | 0.5–3 | L/min, set by pump, verify on datasheet |
| 2 | Ion mobility cut-off | roughly 0.5–2 | cm²/(V·s), instrument-dependent |
| 3 | Collector bias | tens to hundreds | V DC, polarity selects ion sign |
| 4 | Collector current | 10⁻¹³–10⁻¹⁰ | A (0.1–100 pA) |
| 5 | Reported concentration | 0–10⁵ (site dependent) | ions/cm³ |
| 6 | Digital output | RS485 Modbus RTU, 4–20 mA or 0–5 V | interface-dependent |
The first five rows are typical engineering ranges used to explain the signal chain, not NiuBoL model specifications. Confirm every numeric value against the current NiuBoL datasheet before quoting it in a published specification table.
The conversion is simple enough to audit, which makes it a useful acceptance test. Suppose the electrometer reads a steady collector current of 2.0 pA after the zero offset has been subtracted, and the effective sample flow through the chamber is 1.0 L/min. One litre per minute is 1000 cm³ per 60 seconds, or 16.67 cm³/s. The elementary charge is 1.602 × 10⁻¹⁹ C, so the collected charge corresponds to 2.0 × 10⁻¹² / 1.602 × 10⁻¹⁹ = 1.25 × 10⁷ elementary charges per second. Dividing by 16.67 cm³/s gives roughly 7.5 × 10⁵ charges per cm³, and applying a collection efficiency of 0.35 for the chamber geometry gives about 2.1 × 10⁶ ions/cm³ before any mobility cut-off correction.
That number is deliberately higher than what a well-sited outdoor station usually reports. The point of the arithmetic is that the reported concentration is proportional to current and inversely proportional to flow and collection efficiency. If the pump degrades and the real flow falls from 1.0 L/min to 0.8 L/min while the firmware keeps using 1.0 L/min, the instrument under-reports by 20%. If the insulator becomes slightly conductive in humid air and adds 0.2 pA of leakage current, the reported concentration rises by 10% with no change in the air at all. Both failure modes are invisible to a user who only reads the digital output.
This is also why a zero check is part of commissioning. With the inlet capped by an ion-free filter and the pump running, the collector current should settle near the electrometer zero. A persistent offset of more than a few percent of the expected full-scale current points to leakage, contamination or inadequate grounding rather than to an unusually ion-rich environment.
Illustrative calculation only. The currents, flow and efficiency above are worked example values used to show the conversion and its sensitivities; they are not measurements from a NiuBoL project and must not be presented as one.
Buyers often compare only the maximum range and the price. For this instrument class, the more useful parameters are the ones that determine whether two readings can be compared at all.
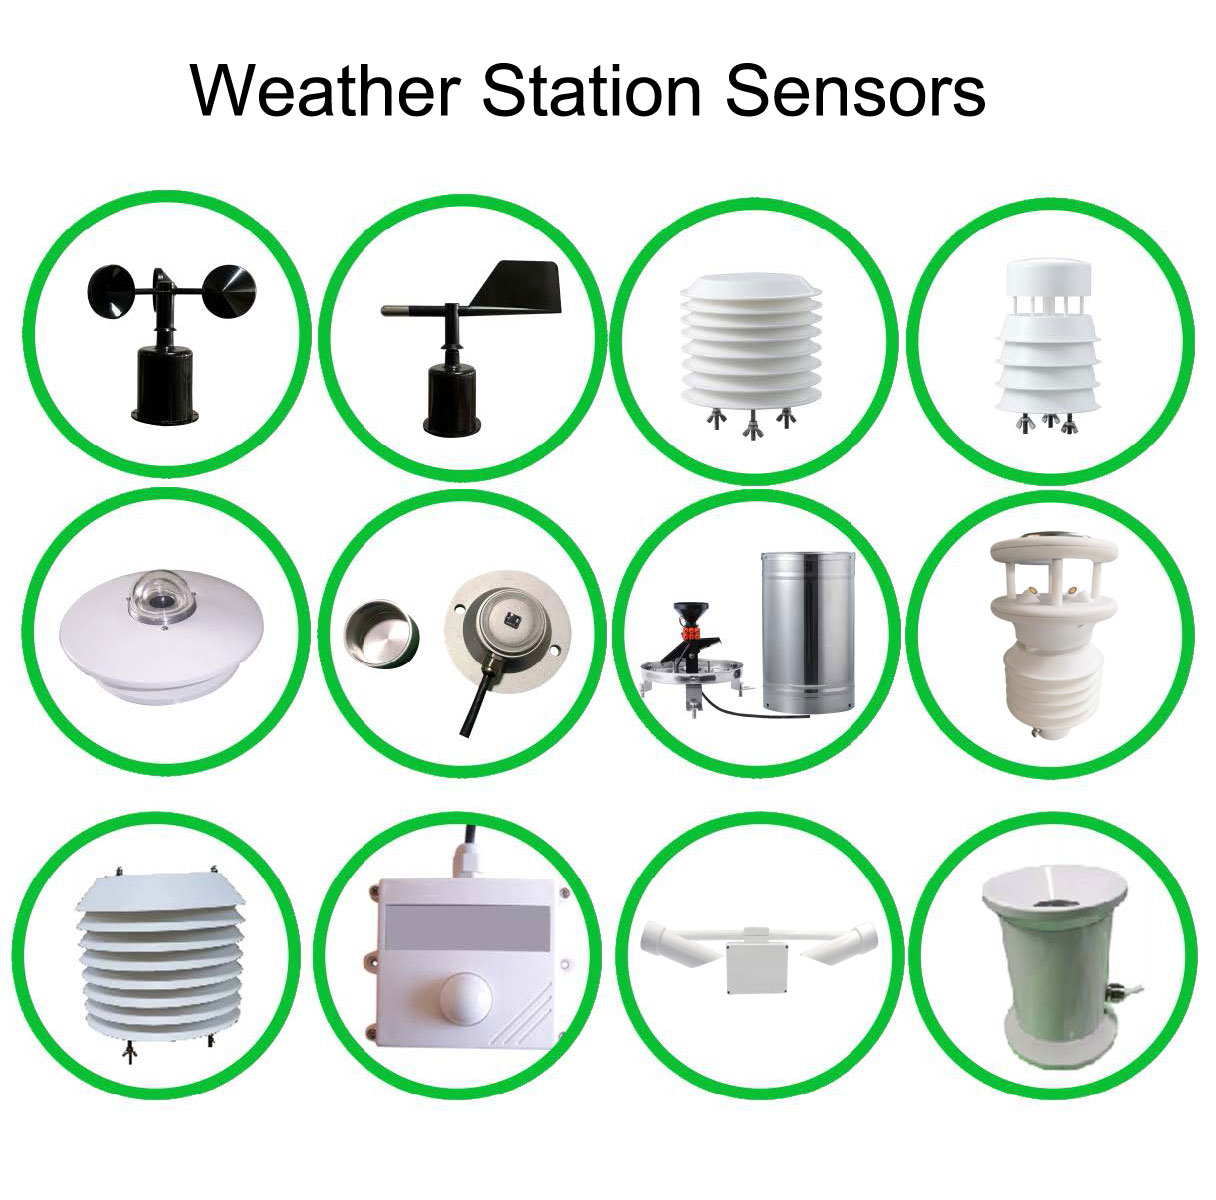
Figure 2. Weather and environmental sensors available for a NiuBoL monitoring station.
| Parameter | Why it decides data quality | What to ask the supplier |
|---|---|---|
| Mobility cut-off | Defines which ion sizes are counted | State the cut-off and how it is set by geometry/voltage |
| Sample flow accuracy and stability | Scales the concentration linearly | Flow tolerance, drift over time, and whether flow is measured or assumed |
| Electrometer zero drift | Produces a fixed offset at low concentrations | Offset in pA, temperature coefficient, zero-check procedure |
| Humidity operating range | Moisture films create leakage paths | RH range without condensation, and behavior above it |
| Response time | Determines whether short events are visible | T90 at a stated flow and step change |
| Output and protocol | Determines integration cost | RS485 Modbus RTU register map, or 4–20 mA / 0–5 V scaling |
| Ingress protection and grounding | Controls long-term stability outdoors | Enclosure rating, shield/earth scheme, cable recommendation |
NiuBoL's environmental monitoring equipment commonly exposes RS485 Modbus RTU alongside 4–20 mA and 0–5 V options, and its industrial enclosures are specified for outdoor use. Those interface options are useful here: a Modbus channel preserves the raw concentration word and diagnostic flags, whereas a 4–20 mA loop hides the zero drift inside the loop current. For a monitoring network where data from several sites will be compared, the digital path is the safer choice. Verify the exact register map, power requirement and enclosure rating for the specific negative ion model on the current NiuBoL datasheet.
Humidity and condensation. Water films on insulators create leakage current that the electrometer cannot distinguish from ion current. Above roughly 80% RH, and especially near dew point, expect an upward bias and slow recovery. A station that reports its highest ion counts during fog is usually reporting its insulator, not the air.
Airflow and siting. Because the instrument pulls a defined sample volume, anything that changes the air presented to the inlet changes the reading. Installing the inlet within a meter of a wall, under a canopy, or downwind of a ventilation outlet biases the sample. Vegetation, waterfalls and fountains generate real ions; a road or a combustion source generates charged particles that can suppress or mask the small-ion population.
Nearby high-voltage equipment. Corona discharge from poorly maintained switchgear, electrostatic precipitators or ion generators produces large local ion populations. A monitor placed near such a source will show sharp spikes that have nothing to do with regional air quality.
Grounding and cable leakage. A picoampere signal is vulnerable to ground loops and triboelectric noise in a moving cable. Use a shielded, fixed cable, a single, deliberate earth point, and keep the electrometer lead short. A floating shield can look like a slowly varying concentration.
Pump and inlet degradation. Dust loading reduces flow; a worn fan changes it. If flow is assumed rather than measured, the concentration is wrong in direct proportion. Scheduled flow checks catch this before the data is used.
Long-term zero drift. Without a periodic zero check, a small offset accumulates into a persistent baseline error that is easy to mistake for a seasonal trend.
Consider a hypothetical hillside station logging at 5-minute intervals. Overnight it reports 1,200–1,600 ions/cm³, rises to about 2,000 near dawn, falls to 400–600 during a dry, windy afternoon, and recovers after sunset. Relative humidity follows the inverse pattern. There are two plausible readings of this dataset: a genuine diurnal ion cycle, or humidity-driven leakage inflating the night-time values. The way to separate them is not to argue about the shape of the curve but to run a capped-inlet zero check at the highest-humidity hour, then compare the offset to the night-time signal. If the offset accounts for a large fraction of the peak, the "diurnal cycle" is an instrument artefact.

Figure 3. Forested landscape illustrating an outdoor environmental monitoring setting.
A second check is to compare two co-located units with different mobility cut-offs. Real changes in the small-ion population should move both readings in the same direction; a leakage or grounding fault usually appears on only one channel. Neither check requires a reference laboratory, and both can be written into a site acceptance procedure.
Again, this dataset is an illustrative worked example for method, not a NiuBoL field record.
Q1. What does a negative ion monitor measure, in one sentence?
It measures the number concentration of small negative air ions in ions/cm³ by collecting their charge as a picoampere-scale current and dividing by charge, flow and collection efficiency.
Q2. Is a negative ion monitor the same as a PM2.5 sensor?
No. PM2.5 sensors measure particle mass concentration optically; negative ion monitors measure charge carriers in the air. They respond to different physics and are not interchangeable.
Q3. Why do two monitors at the same site disagree?
Most often because of different mobility cut-offs, different sample flow calibration, or different zero offsets. Compare the raw currents and the flow settings before comparing the displayed concentrations.
Q4. Can high humidity damage the instrument?
Condensation can create persistent leakage paths and long recovery times, though it may not cause permanent damage. Check the specified RH range without condensation and avoid siting the inlet where fog pools.
Q5. Which output should I choose for a multi-site network?
RS485 Modbus RTU where the logger supports it, because it preserves diagnostics and the raw value. Use 4–20 mA only when the receiving system has no digital input.
Q6. How often should the zero be checked?
At commissioning, after any wet-weather event that approaches dew point, and at the interval established by the observed zero drift on your own site.
Prev:IoT Irrigation Monitoring System: Sensor Connections and Field Tests
Next:Soil Moisture Sensors in the Field: Placement, Telemetry and a Worked Irrigation Example
Related recommendations
Sensors & Weather Stations Catalog
 Agriculture Sensors and Weather Stations Catalog-NiuBoL.pdf
Weather Stations Catalog-NiuBoL.pdf
Agriculture Sensors Catalog-NiuBoL.pdf
Water Quality Sensor Catalog-NiuBoL.pdf
Related products
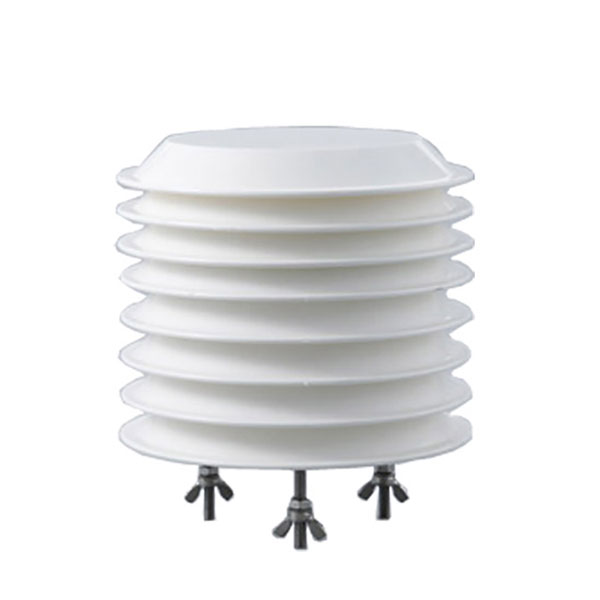 Combined air temperature and relative humidity sensor
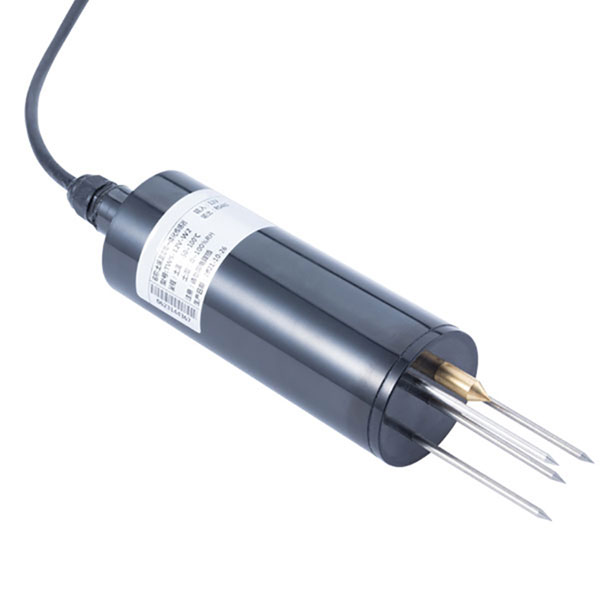 TDR Soil Moisture & Temperature Sensor for irrigation| RS485 |4-20mA| NBL-S-THR
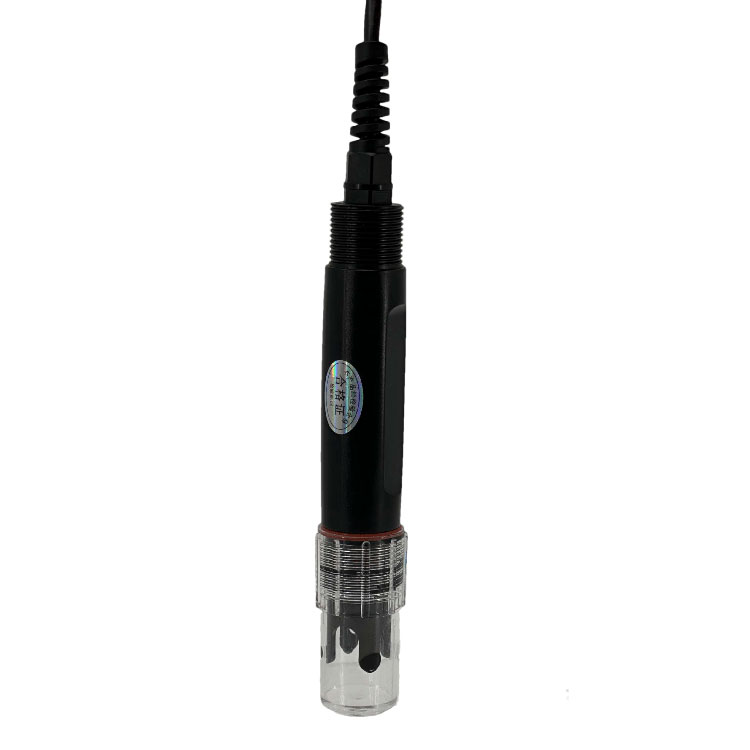 Soil pH sensor RS485 soil Testing instrument soil ph meter for agriculture |NBL-S-PH
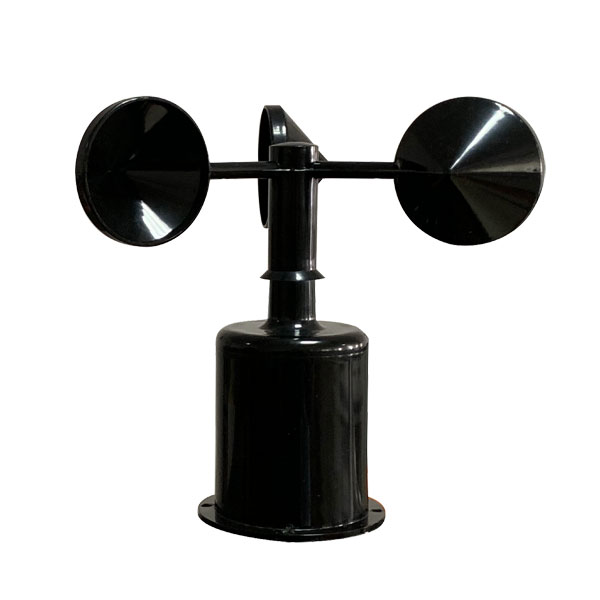 Wind Speed sensor Output Modbus/RS485/Analog/0-5V/4-20mA
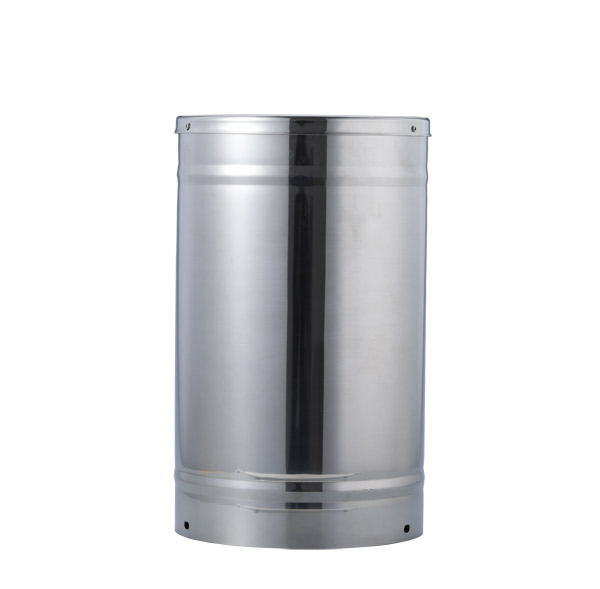 Tipping bucket rain gauge for weather monitoring auto rainfall sensor RS485/Outdoor/stainless steel
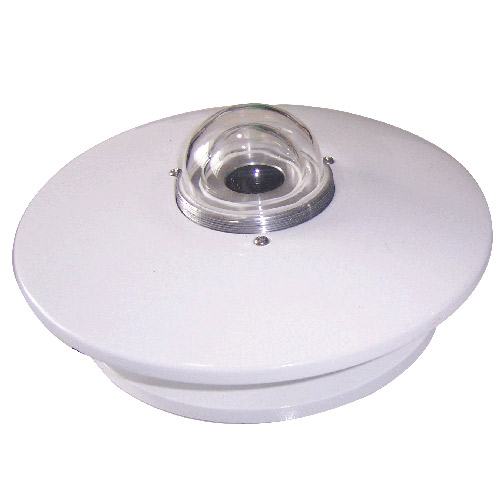 Pyranometer Solar Radiation Sensor 4-20mA/RS485

Screenshot, WhatsApp to identify the QR code
WhatsApp number:+8615367865107
(Click on WhatsApp to copy and add friends)