


— Blogs —
—Products—
 Consumer hotline +8618073152920
 WhatsApp:+8615367865107
Address:Room 102, District D, Houhu Industrial Park, Yuelu District, Changsha City, Hunan Province, China
Product knowledge
Time:2026-06-11 11:24:31 Popularity:231
A sensor can only report the water it actually sees. In online water quality systems, the monitoring section is therefore a design decision, not a small site detail.
In project specifications, this subject is often described through terms such as water quality monitoring section layout, online monitoring cross-section design, river water quality monitoring points, RS485 water quality station, and application contexts including river monitoring station, lake reservoir monitoring, pollution source supervision.
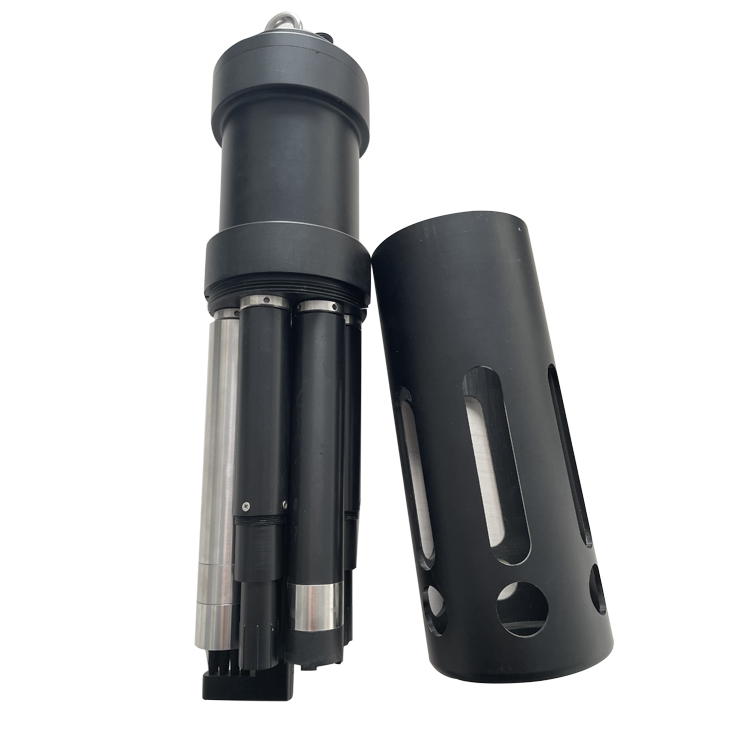
Automatic water quality systems are widely used in water plants, wastewater plants, rivers and lakes. Parameters such as temperature, color, suspended solids, pH, chlorine, turbidity, conductivity, DO, COD and ammonia nitrogen can be measured continuously, but accuracy depends heavily on representative sampling.
For procurement teams, the useful question is not only which parameter can be measured, but where the sensor should sit, how the signal enters the control system, how the data is verified, and what decision the plant will make from the trend.
NiuBoL sensors are deployed at selected sections and connected to sub-stations or fixed monitoring points. The station then reports data to a central platform or SCADA system.
The field sensor is the first layer of the monitoring architecture. The cabinet or gateway handles power, isolation and communication, while SCADA or cloud software converts values into alarms, reports and maintenance tasks.
For B2B water quality projects, communication compatibility is part of the equipment value. RS485 and Modbus RTU allow field sensors to connect with PLCs, DCS, RTUs, SCADA servers, data acquisition units and IoT gateways. This keeps the measurement layer open enough for integrators and avoids locking the buyer into a display-only instrument.
RS485 Modbus RTU helps standardize field data acquisition across several fixed stations. The same gateway can collect pH, DO, turbidity, conductivity and other values from each section.
For water quality monitoring section layout, the data path should be designed before the cabinet is assembled. The integrator should decide which values are displayed locally, which values are used for alarms, which values are uploaded to SCADA or cloud software, and which values need laboratory comparison records.
A practical architecture separates the field layer, cabinet layer and platform layer. The sensor produces the measured value, the cabinet handles power supply and communication protection, and the platform stores trends, alarms and reports. This separation is useful for distributors because it makes troubleshooting easier: a field fouling issue, a cabinet wiring issue and a platform mapping issue can be checked one by one instead of being treated as one vague instrument fault.
The table provides a station-level technical reference because section-layout projects usually combine several water quality sensors.
| Parameter | Specification |
|---|---|
| Monitoring architecture | Multi-parameter station with digital probes and analyzers selected by process risk |
| Typical measured parameters | pH, ORP, turbidity, TSS, DO, conductivity, residual chlorine, ammonia nitrogen, COD or BOD as project options |
| Power supply | 12 to 24 VDC for digital probes; cabinet supply according to gateway and analyzer load |
| Output signal | RS485, Modbus RTU; optional 4-20 mA on selected instruments |
| Protection rating | IP68 for submerged sensor bodies; cabinet protection selected by installation environment |
| Working temperature | Typically 0 to 50 degC for many digital probes; confirm by selected instrument |
| Installation | Immersion bracket, flow cell, sampling line, station house or cabinet-mounted analyzer |
| Cable material / length | Shielded waterproof cable, 5 m standard on many probes, customizable |
| Integration interface | PLC, DCS, RTU, SCADA, data acquisition unit and IoT gateway |
| Maintenance design | Sampling, cleaning, calibration and laboratory comparison plan defined by parameter |
A control section should reflect pollution impact, a comparison section should reflect upstream background, and a downstream attenuation section should help evaluate dilution and self-purification. If these sections are confused, the data may look precise but answer the wrong question.
A useful sensor installation produces a trend that can be checked against flow, chemical dosing, pump status, treatment stage and laboratory verification. This is why the project should define alarm delay, register scaling, unit conversion, data storage interval and manual verification method during design, not after commissioning.
The main risk in a water quality monitoring section layout project is usually not one isolated specification line. It is the combination of sample representativeness, fouling, chemical interference, cable routing, power stability, platform mapping and operator maintenance discipline. A good procurement review therefore checks the whole measurement chain, from wetted materials and installation accessories to Modbus registers, cabinet labels and spare-part availability.
The safest project approach is to review the measurement point, communication route and maintenance route together. If the sample point is wrong, a perfect Modbus signal still carries poor process information. If the cable route is noisy, a good probe may look unstable. If the sensor cannot be removed for service, the owner may stop maintaining it after the first month. Treating these risks during design is usually less expensive than correcting them after installation.
Site environment challenge: The project needs a background value before local pollution influence.
System integration scheme: Place the station upstream of the city or industrial discharge area.
User value delivered: Managers can separate incoming water quality from local impact.
Site environment challenge: The section must show the combined effect of discharge sources.
System integration scheme: Locate the station downstream where pollutants and river water are adequately mixed.
User value delivered: The data reflects real pollution pressure from the monitored area.
Site environment challenge: The owner needs to understand dilution and self-purification downstream.
System integration scheme: Install a station further downstream after mixing and natural reduction.
User value delivered: Trend data supports water-environment assessment.
Site environment challenge: Several inflows and seasonal changes affect water quality.
System integration scheme: Select sections by inflow, shoreline pollution and ecological sensitivity.
User value delivered: Monitoring resources are used where changes are most meaningful.
Selection should start from the process objective, the water matrix and the required data use. A sensor for alarm only, a sensor for closed-loop control and a sensor for compliance evidence are not specified in exactly the same way.
Maintenance frequency should follow the water quality and the measurement principle. Clean water points may only need scheduled inspection, while wastewater, high-solids water, chlorinated water or aquaculture water may need more frequent cleaning and verification.
For project quotation, maintenance should be treated as part of the technical scope. The buyer should know whether the instrument needs buffer calibration, zero and slope calibration, optical-window cleaning, flow-cell inspection, reagent replacement, membrane or cap replacement, or laboratory cross-checking. When these items are clear before purchase, the site team can budget spare parts and avoid blaming the communication system for a normal sensor service requirement.
Most field problems come from sample representativeness, fouling, cabling or maintenance access rather than from the catalogue value alone.
For distributors, OEM cabinet builders and engineering contractors, the purchase file should include model, measured parameter, output signal, cable length, mounting accessory, wetted material, power requirement, Modbus address plan and expected maintenance parts. A short acceptance record with installation photos and initial readings helps the customer understand what has been delivered.
When several parameters are included in one project, a register table and wiring schedule should be prepared before cabinet assembly. This makes future expansion easier if the customer later adds another pH point, chlorine point, DO probe, turbidity probe, TSS sensor or data upload gateway.
Before ordering, it is useful to collect site photos, pipe or tank dimensions, expected cable route, available power supply, cabinet location and the name of the controller or gateway. These details often decide whether the project needs a simple probe, a flow cell, an analyzer cabinet or a complete monitoring station.
A reasonable acceptance test compares the online reading with a site reference method, checks Modbus polling over the expected cable route, confirms alarm behavior and records the first calibration or verification result.
Acceptance should include more than checking whether a number appears on the screen. The project team should verify sensor response, communication stability, unit scaling, alarm thresholds, trend storage, cabinet labeling, cable sealing and maintenance access. For remote projects, it is also useful to capture several hours of trend data before handover so that the owner can see that the measurement point is stable under real site operation.
Yes. The recommended integration path is RS485 with Modbus RTU, so sensors can be connected to PLC, RTU, DCS, SCADA or IoT gateways without a closed data interface.
Where the selected instrument supports optional 4-20 mA, analog output can be used for an existing controller while RS485 Modbus RTU is used for data logging and diagnostics.
Calibration should be written into the operation plan by parameter. pH, residual chlorine, DO, turbidity, TSS and reagent-based analyzers do not share the same cleaning or verification interval.
Because a sensor reading is only meaningful if the monitoring point represents the water body or pollution impact being evaluated.
Use a single sensor when one control variable is dominant. Use a station when several parameters must be interpreted together, such as pH with chlorine, DO with ammonia, or COD with flow.
Provide water type, expected range, temperature, pressure, installation point, cable length, output requirement, controller model and whether the project needs a flow cell, bracket or station cabinet.
Check IP rating, cable gland sealing, junction box protection, lightning protection, grounding and whether the probe can be removed for maintenance without stopping the process.
The number depends on pollution sources, hydrology, monitoring purpose and budget; the aim is sufficient representativeness with the fewest practical points.
NiuBoL can support datasheets, wiring information, product selection and integration notes for distributors, OEM cabinet builders and engineering contractors.
Delivery time is affected by sensor quantity, cable customization, cabinet configuration, accessories, calibration requirements and whether the project includes several parameters or only one field probe.
Monitoring section layout decides whether online water quality data can support real decisions. NiuBoL multi-parameter stations and RS485 Modbus RTU sensors can be deployed across reference, control and attenuation sections for rivers, lakes and reservoirs.
Prev:Online Water Quality Monitoring System Design for Small Stations and IoT Projects
Next:Common Water Quality Sensors and How to Select Them for Industrial Projects
Related recommendations
Sensors & Weather Stations Catalog
 Agriculture Sensors and Weather Stations Catalog-NiuBoL.pdf
Weather Stations Catalog-NiuBoL.pdf
Agriculture Sensors Catalog-NiuBoL.pdf
Water Quality Sensor Catalog-NiuBoL.pdf
Related products
 Combined air temperature and relative humidity sensor
 Soil Moisture Temperature sensor for irrigation|NBL-S-THR
 Soil pH sensor RS485 soil Testing instrument soil ph meter for agriculture |NBL-S-PH
 Wind Speed sensor Output Modbus/RS485/Analog/0-5V/4-20mA
 Tipping bucket rain gauge for weather monitoring auto rainfall sensor RS485/Outdoor/stainless steel
 Pyranometer Solar Radiation Sensor 4-20mA/RS485

Screenshot, WhatsApp to identify the QR code
WhatsApp number:+8615367865107
(Click on WhatsApp to copy and add friends)
