





— Blogs —
—Products—
 Consumer hotline +8618073152920
WhatsApp:+8615367865107
Address:Room 102, District D, Houhu Industrial Park, Yuelu District, Changsha City, Hunan Province, China
Product knowledge
Time:2026-09-24 11:00:00 Popularity:223
Total nitrogen and total phosphorus monitoring should identify when the water was sampled, when the analysis finished and whether the result is valid. A frequently updated PLC register may still contain an older completed analysis. Specify the sample fraction, analytical method and result-age handling before comparing nutrient-monitoring packages or connecting their outputs to process decisions.
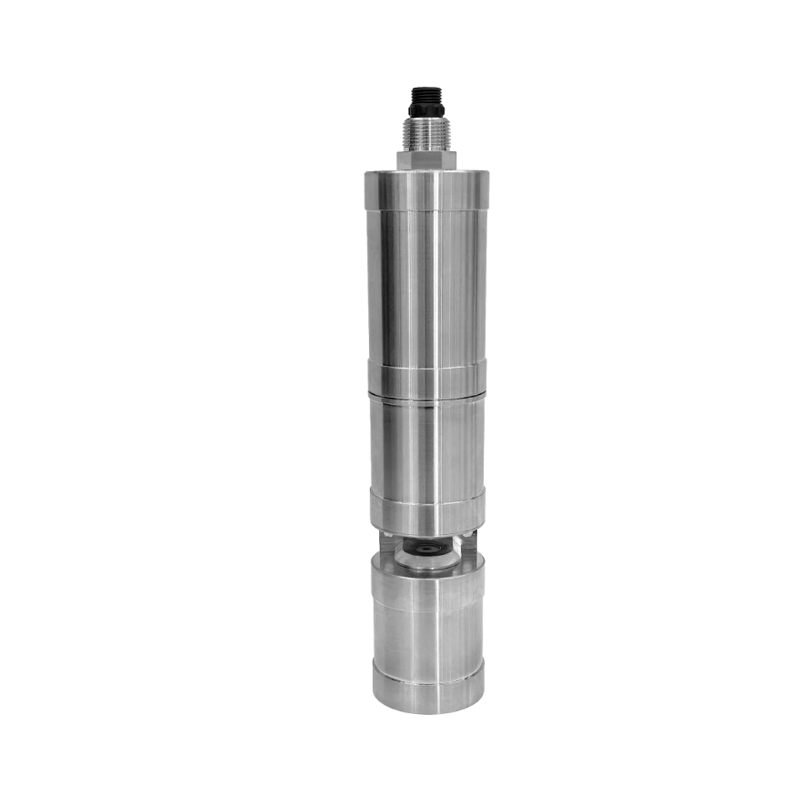
A plant can have a continuously polled sensor bus alongside an analyzer that completes separate sample-processing cycles. Those are different update patterns. The host needs to know whether a new number represents fresh water, a completed analysis of earlier water or a retained result while the instrument is cleaning or unavailable.
For an illustrative timeline, water collected at 10:00 may produce a completed result at 10:20. Displaying that value at 10:20 does not make it a measurement of water entering the plant at that moment. These times are a constructed example, not a stated cycle time for a NiuBoL device.
| Time or state | Meaning to preserve | Why the project needs it |
|---|---|---|
| Sample collection time or interval | The water represented by the result | Match laboratory comparisons and process events to the correct sample. |
| Analysis completion time | When the result became available | Assess the delay before an operating decision can use it. |
| Last valid result and age | The most recent accepted observation, not necessarily current water | Prevent retained data from appearing fresh during an interruption. |
| Cycle and quality status | Sampling, analysis, service, failed check or valid completion as supported | Keep an incomplete or failed cycle separate from a valid low nutrient result. |
Write TN as nitrogen and TP as phosphorus with their agreed reporting units. Define whether the project requires a whole-water total or a dissolved fraction and how the sample is prepared. Removing suspended material can change the nutrient fraction delivered to analysis; a clear sample is not automatically the right sample for a whole-water total.
The EPA nutrient-measurement overview distinguishes individual nitrogen species from total nitrogen and describes digestion-based phosphorus measurements. It also notes that nutrient methods are not always interchangeable. Use the method required by the project rather than assuming that a shared mg/L unit makes different results equivalent.
An ammonium-selective probe does not supply total nitrogen. Nitrate alone also leaves other nitrogen forms unmeasured, and neither of these channels supplies phosphorus. They can support process investigation, but their names and uses should remain separate from the required total-parameter analysis.
Conductivity, shown below as a separate EC instrument, can help describe changing ionic water. It cannot establish TN or TP concentration and should not be used to fill a missing nutrient-analysis channel.
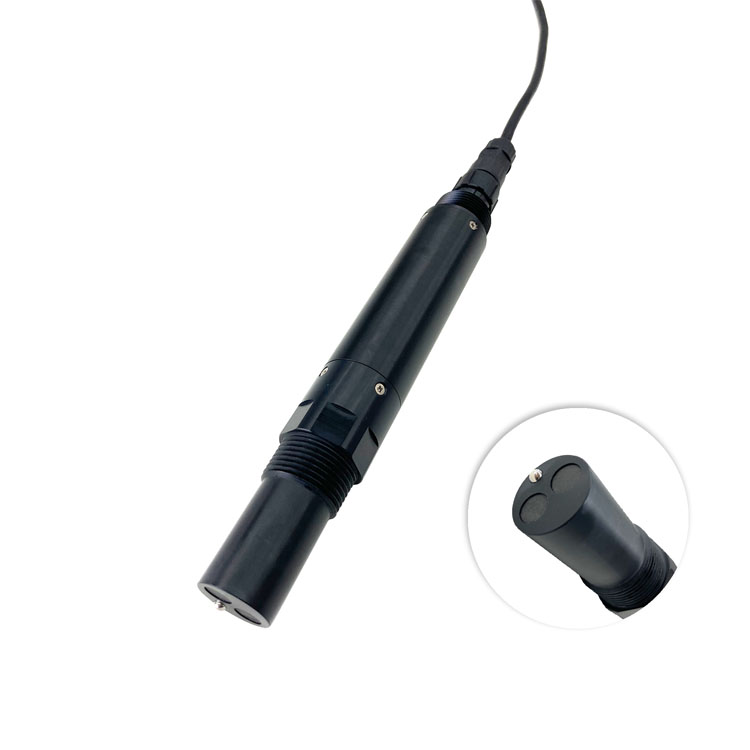
The NiuBoL NBL-WQ-FUV-408 uses full-spectrum absorption and lists several parameter outputs, including TN and TP. Treat those spectral outputs as estimates requiring a demonstrated relationship with the selected reference method and actual water matrix. Multiple output labels do not establish independent chemical recovery of every nitrogen or phosphorus form.
For a trial, compare representative split samples across relevant solids and process conditions. Keep the online observation, reference sampling time, fraction and preparation together. A relationship established during one stable operating period may not remain adequate after the influent composition or solids content changes.
| FUV-408 characteristic | Listed configuration | Decision boundary |
|---|---|---|
| Method and output | Full-spectrum absorption; RS485 Modbus RTU | Validate the delivered parameter definitions and model against the intended reference. |
| TN output | 0–100 mg/L; ±5% FS; resolution 0.1 mg/L | The full-scale term is 5 mg/L, not 5% of every low reading. |
| TP output | 0–15 mg/L; ±5% FS; resolution 0.1 mg/L | The full-scale term is 0.75 mg/L; assess useful performance at the actual decision region. |
| Operating envelope | 0–45 °C; pressure <0.1 MPa; IP68; 316L housing | Confirm sample exposure and access for optical inspection and cleaning. |
| Installation and cable | Immersion no deeper than 2 m; at least 30 cm below the lowest expected level; standard 5 m cable | Specify cable jacket and protected joints; keep bubbles away from the optical region. |
| Electrical supply and load | Use 12 VDC as the design basis; confirm the delivered allowable voltage, operating load and cleaning-cycle load | Approve the complete power specification before sizing the cabinet supply or solar reserve. |
A comparison for process trending and acceptance for a particular reporting duty are separate decisions. Obtain the required method and acceptance basis from the responsible project team. Do not describe an optical estimate as an approved compliance method without the applicable evidence.
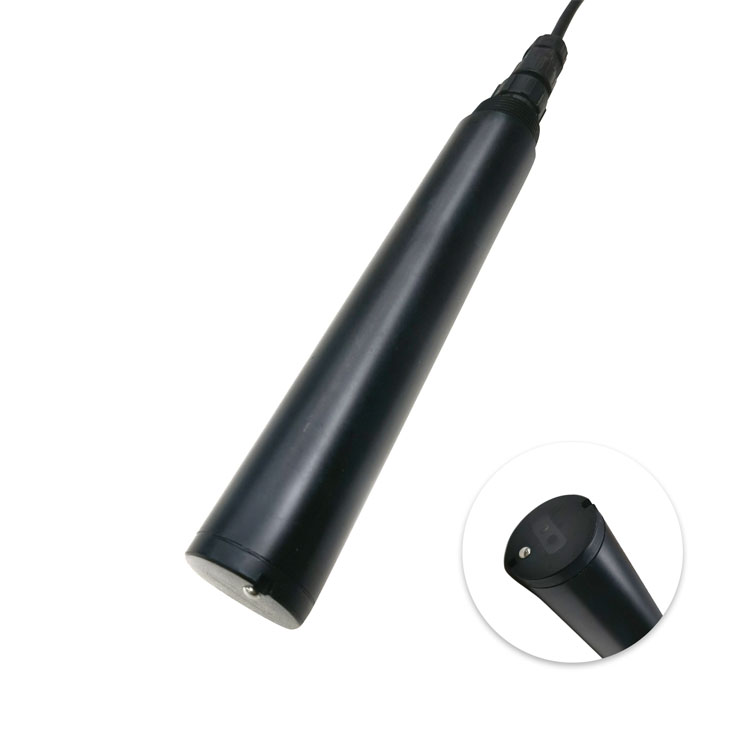
The following turbidity probe is a supporting particle channel, not a total-phosphorus analyzer. Its trend can help identify conditions needing closer sampling, but it cannot quantify the missing phosphorus fraction.
If TN and TP instruments use different sample routes or cycle schedules, their latest displayed values may describe different water. Record collection intervals and compare matched samples where the process question requires it. A grab sample, a time composite and an optical instantaneous observation should not be plotted as equivalent events without explaining the difference.
Check the sample system under normal solids loading. Settling, blocked intakes or unintended filtration can bias what reaches the instrument even when the analytical unit passes its own checks. Preserve the required sample fraction through the route and define the maintenance needed to keep that route representative.
For stations that also require COD or ammonium, the discharge indicator and analytical-scope guide explains how the parameter duties differ. Keep the sampling and result time attached to each channel rather than assuming all four values represent the same water.
At the PLC, RTU or data logger, map the actual value, unit and available result-quality information. Where the device does not transmit all required timing fields, define how the acquisition application will associate results with samples. Do not manufacture a fresh sample time every time the host polls an unchanged register.
Test a failed or interrupted cycle and a return from maintenance. The approved alarm or control arrangement should distinguish unavailable analysis from a valid low result. A historical trend can retain the last accepted number, but operators need its age and availability state.
For a NiuBoL inquiry, provide TN and TP method requirements, expected concentrations, sample fraction, solids behavior and the decision deadline. Identify reference sampling, required status fields and any optical-trial scope. This permits comparison of a complete measuring arrangement rather than a list of nutrient labels.

No. Those channels do not establish every nitrogen form included in the required total. Specify the complete method and reporting basis separately.
No. Polling retrieves available data. It does not shorten the sampling or analysis cycle or change the water represented by the latest completed result.
Only if that preparation is consistent with the required measurement. Removing solids can change a whole-water total into a different sample fraction.
No. Establish its relationship, operating conditions and acceptance for the intended use. A parameter name or stable trend is not method-equivalence evidence.
Preserve sample identity, collection time or interval, preparation, reference result, online value and relevant process conditions. Include water changes that could invalidate a correlation.
State sample collection, analysis completion, result age and supported cycle or quality states. Define how unavailable results appear at the host and which decisions they may influence.
Total nitrogen and total phosphorus monitoring requires more than two displayed values. Define the sample and method, preserve the time represented by each result and distinguish process estimates from the required analytical duty. Compare packages by the complete sample-to-result chain and its demonstrated performance.
Prev:Nitrate Sensor for Agricultural Runoff: Storm Sampling and Flow Alignment
Next:Online Water Color Measurement: Match the Reference Method
Related recommendations
Sensors & Weather Stations Catalog
 Agriculture Sensors and Weather Stations Catalog-NiuBoL.pdf
Weather Stations Catalog-NiuBoL.pdf
Agriculture Sensors Catalog-NiuBoL.pdf
Water Quality Sensor Catalog-NiuBoL.pdf
Related products
 Combined air temperature and relative humidity sensor
 TDR Soil Moisture & Temperature Sensor for irrigation| RS485 |4-20mA| NBL-S-THR
 Soil pH sensor RS485 soil Testing instrument soil ph meter for agriculture |NBL-S-PH
 Wind Speed sensor Output Modbus/RS485/Analog/0-5V/4-20mA
 Tipping bucket rain gauge for weather monitoring auto rainfall sensor RS485/Outdoor/stainless steel
 Pyranometer Solar Radiation Sensor 4-20mA/RS485


Screenshot, WhatsApp to identify the QR code
WhatsApp number:+8615367865107
(Click on WhatsApp to copy and add friends)

